Philippines Ride-Sharing Services Market Outlook to 2035
By Service Type, By Vehicle Category, By Trip Purpose, By Pricing Model, and By Region
Report Overview
Report Code
TDR0531
Coverage
Asia
Published
January 2026
Pages
80
Flexible Purchase Options
Select and purchase only the chapters you need for your strategic decisions
On This Page
Report Overview
The report titled “Philippines Ride-Sharing Services Market Outlook to 2035 – By Service Type, By Vehicle Category, By Trip Purpose, By Pricing Model, and By Region” provides a comprehensive analysis of the ride-sharing ecosystem in the Philippines. The report covers the evolution and current structure of the market, overall market size in terms of value and trips, detailed market segmentation, technology and platform trends, regulatory and licensing landscape, rider and driver behavior profiling, key operational challenges, and competitive landscape including platform positioning, monetization strategies, partnerships, and company profiling of major ride-sharing operators.
Report Coverage
Verified Market Sizing
Multi-layer forecasting with historical data and 5–10 year outlook
Deep-Dive Segmentation
Cross-sectional analysis by product type, end user, application and region
Competitive Benchmarking & Positioning
Market share, operating model, pricing and competition matrices
Actionable Insights & Risk Assessment
High-growth white spaces, underserved segments, technology disruptions and demand inflection points
Review Methodology & Data Structure
Preview report structure, data sources and research framework
Executive Summary
The report titled “Philippines Ride-Sharing Services Market Outlook to 2035 – By Service Type, By Vehicle Category, By Trip Purpose, By Pricing Model, and By Region” provides a comprehensive analysis of the ride-sharing ecosystem in the Philippines. The report covers the evolution and current structure of the market, overall market size in terms of value and trips, detailed market segmentation, technology and platform trends, regulatory and licensing landscape, rider and driver behavior profiling, key operational challenges, and competitive landscape including platform positioning, monetization strategies, partnerships, and company profiling of major ride-sharing operators. The report concludes with forward-looking projections based on urban mobility demand, public transport gaps, smartphone and digital payments penetration, regulatory clarity, electrification of fleets, and case-based illustrations highlighting the major opportunities and risks shaping the market through 2035.
Philippines Ride-Sharing Services Market Overview and Size
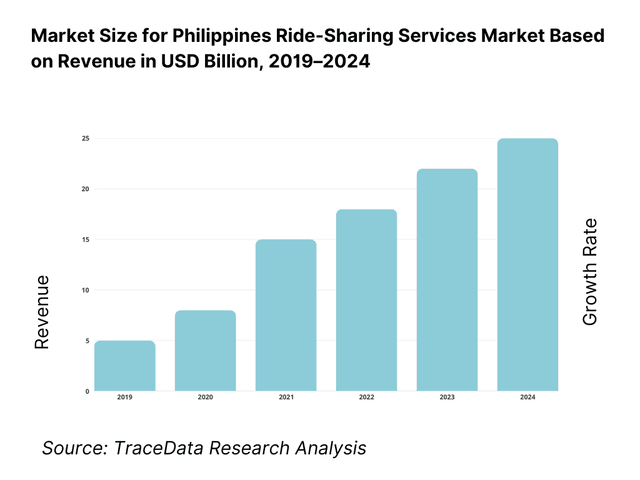
The Philippines ride-sharing services market is valued at approximately ~USD ~ billion, representing app-based platforms that connect passengers with private vehicles, taxis, motorcycles, and shared mobility options through digital marketplaces. Ride-sharing services in the Philippines primarily cover ride-hailing for cars and motorcycles, with growing extensions into taxi aggregation, premium services, corporate mobility solutions, and, in selected cities, shared or pooled rides.
Market growth is anchored by rapid urbanization, high population density in major metro areas, chronic traffic congestion, and structural gaps in public transportation coverage and reliability. Ride-sharing platforms have emerged as a critical mobility layer for daily commuting, first- and last-mile connectivity, airport transfers, and on-demand point-to-point travel. High smartphone penetration, widespread use of digital wallets, and increasing comfort with app-based services have further normalized ride-sharing as a mainstream transport option rather than a discretionary service.
Metro Manila represents the largest demand center, driven by severe congestion, long average commute times, and strong demand from office commuters, students, and service-sector workers. Secondary urban markets such as Cebu, Davao, Iloilo, Bacolod, and Cagayan de Oro are witnessing accelerating adoption as urban sprawl increases and local transport systems struggle to keep pace with mobility needs. Tourist hubs and airport-linked corridors also contribute to steady demand from domestic and international travelers seeking convenience, safety, and price transparency.
Motorcycle-based ride-hailing plays a structurally important role in the Philippines due to narrow roads, high congestion, and affordability considerations, while car-based services dominate airport transfers, family travel, and longer urban trips. Over time, the market is evolving toward more differentiated service tiers, subscription-like driver incentive models, and deeper integration with food delivery, logistics, and digital finance ecosystems.
What Factors are Leading to the Growth of the Philippines Ride-Sharing Services Market:
Urban congestion and public transport limitations sustain daily ride-sharing demand: Major Philippine cities face persistent traffic congestion, limited rail coverage, and inconsistent bus and jeepney services, resulting in long and unpredictable commute times. Ride-sharing platforms offer point-to-point convenience, route flexibility, and real-time availability that directly address these pain points. For many urban users, ride-sharing fills critical gaps during peak hours, late-night travel, and areas with weak public transport connectivity. Motorcycle ride-hailing, in particular, has become a practical solution for navigating congested corridors and reducing travel time variability.
Digital ecosystem maturity lowers adoption friction for riders and drivers: High smartphone penetration, widespread mobile data access, and the deep integration of digital wallets and cashless payment options have reduced barriers to ride-sharing adoption. Users can seamlessly book, pay, rate, and rebook services within a single app environment, while drivers benefit from simplified onboarding, navigation support, and earnings visibility. Platform-driven promotions, loyalty programs, and bundled offerings across mobility, food delivery, and financial services further strengthen user stickiness and frequency of use.
Flexible income opportunities and platform economics expand driver supply: Ride-sharing continues to attract a large pool of drivers seeking flexible income opportunities amid underemployment and informal labor dynamics in the Philippines. Platforms enable part-time and full-time participation, with relatively low entry barriers compared to traditional taxi operations. Over time, platforms are refining incentive structures, fuel and vehicle partnerships, and financing tie-ups to stabilize driver supply, reduce churn, and improve service reliability. These supply-side dynamics are essential for sustaining service coverage and supporting geographic expansion beyond core metro areas.
Which Industry Challenges Have Impacted the Growth of the Philippines Ride-Sharing Services Market:
Regulatory uncertainty, licensing caps, and enforcement variability impact platform scaling and service stability: While ride-sharing has become mainstream in major Philippine cities, the operating environment remains closely tied to government licensing frameworks, accreditation processes, and periodic rule updates. Changes in caps on accredited vehicles, route restrictions, documentary requirements, and enforcement consistency can affect platform capacity planning and driver onboarding. In periods of tighter regulatory control, platforms may face supply constraints, longer wait times, and uneven availability across cities. Regulatory uncertainty also increases investor caution for fleet expansion and slows the rollout of newer models such as pooling, corporate shuttles, and suburban coverage extensions.
Driver supply volatility and earnings pressure create service reliability bottlenecks during peak demand: Ride-sharing platforms depend on stable and motivated driver-partners; however, driver availability can fluctuate due to fuel price changes, incentive revisions, vehicle financing burdens, and competing gig-economy options. When take-home earnings compress, driver churn increases—leading to reduced coverage in non-peak hours and weaker service consistency outside core high-demand zones. This issue becomes more visible during weather disruptions, holiday peaks, and late-night demand windows, where insufficient supply results in cancellations, surge pricing spikes, and customer dissatisfaction.
Traffic congestion, road infrastructure constraints, and operational friction increase trip costs and reduce service efficiency: The Philippines’ urban traffic environment—especially in Metro Manila—creates long idle times, unpredictable travel durations, and higher per-trip fuel and maintenance costs. Congestion reduces vehicle utilization rates and increases the number of unproductive minutes per driver hour, which pushes platforms toward higher fares or heavier incentive spending to retain drivers. Road conditions, limited pickup/drop-off zones, and inconsistent curb management in dense commercial areas further add friction, leading to missed pickups, rerouting, and higher cancellation rates. These structural inefficiencies constrain the extent to which ride-sharing can deliver predictable affordability at scale.
What are the Regulations and Initiatives which have Governed the Market:
Government accreditation frameworks governing operator legitimacy, vehicle eligibility, and driver compliance requirements: The ride-sharing sector operates under government-led accreditation and compliance frameworks that determine which operators can legally provide app-based ride services, how vehicles are classified, and what documentation drivers and vehicles must maintain. These frameworks influence onboarding processes, fleet size controls, safety requirements, and service-area eligibility. Compliance expectations often include valid registrations, professional licensing norms, vehicle inspections, and platform reporting responsibilities, creating a structured pathway for formalizing ride-sharing—but also adding administrative overhead and delays when requirements are updated or enforcement intensifies.
Passenger safety, insurance, and service quality requirements shaping platform policies and operating processes: Safety-focused rules and consumer protection expectations have pushed platforms to strengthen identity verification, trip tracking, emergency support features, and dispute resolution processes. Requirements related to passenger coverage, accident liability, and insurance validity influence platform partnerships with insurers and affect driver operating costs. In practice, these initiatives raise trust and service legitimacy—especially for women riders, late-night users, and tourists—but they also increase compliance costs and platform operational complexity.
Urban mobility initiatives and sustainability direction supporting future integration with multimodal transport and EV transition: Over the outlook period, urban mobility planning in the Philippines is increasingly focused on decongestion, improved public transport integration, and emissions reduction. This creates indirect tailwinds for ride-sharing platforms that can support first/last-mile connectivity, corporate mobility substitution, and flexible point-to-point coverage in underserved areas. Sustainability direction—especially around electrification and cleaner transport—may encourage pilots for EV ride-hailing fleets, charging partnerships, and green financing tie-ups. While adoption will vary by city and infrastructure readiness, these initiatives are expected to shape long-term platform strategies, fleet economics, and partnership models through 2035.
Philippines Ride-Sharing Services Market Segmentation
By Service Type: Motorcycle-based ride-hailing holds structural dominance in the Philippines ride-sharing market. This is because motorcycles are better suited to congested urban roads, narrow streets, and short-distance commuting patterns that define daily mobility in major cities. Motorcycle ride-hailing offers faster travel times and lower fares, making it the preferred option for price-sensitive commuters, students, and service-sector workers. Car-based ride-hailing continues to grow steadily, particularly for airport transfers, family travel, corporate mobility, and longer-distance urban trips, while taxi aggregation and premium services address specific reliability and comfort-driven use cases.
.png&w=640&q=75)
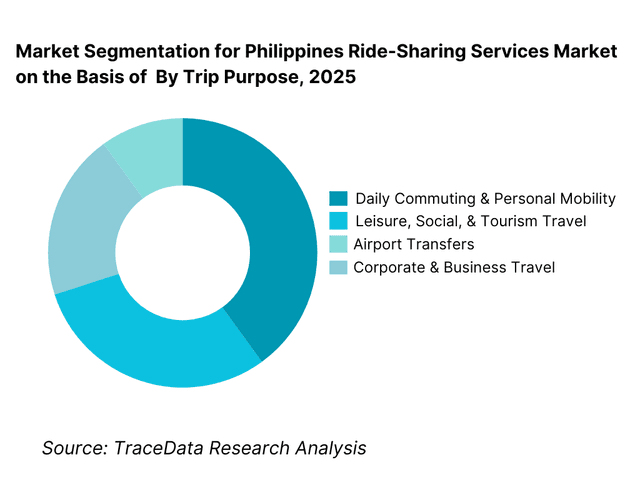
By Trip Purpose: Daily commuting dominates ride-sharing demand in the Philippines, driven by inadequate public transport coverage, long travel times, and inconsistent service reliability. Office commutes, education-related travel, and routine personal trips account for a majority of bookings. Leisure, airport, and tourism-related trips form a stable secondary segment, particularly in Metro Manila, Cebu, and major tourist corridors. Corporate and business travel remains a smaller but higher-value segment, supported by employer reimbursements, account-based billing, and service reliability requirements.
Competitive Landscape in Philippines Ride-Sharing Services Market
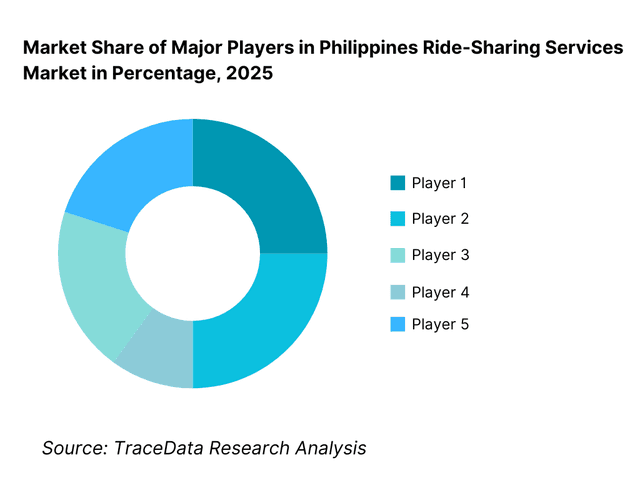
The Philippines ride-sharing services market exhibits high concentration, with a small number of dominant super-app platforms controlling a majority of ride volumes, driver supply, and ecosystem integrations. Competitive positioning is shaped by scale of active users, depth of driver network, regulatory compliance capability, pricing discipline, and integration with adjacent services such as food delivery, payments, and logistics. Large platforms benefit from network effects, brand trust, and the ability to absorb regulatory and incentive-related costs, while smaller players operate in niche geographies or service categories.
Name | Founding Year | Original Headquarters |
Grab | 2012 | Singapore |
Angkas | 2016 | Manila, Philippines |
JoyRide | 2019 | Manila, Philippines |
Move It | 2020 | Manila, Philippines |
inDrive | 2013 | Mountain View, California, USA |
OWTO | 2018 | Manila, Philippines |
Some of the Recent Competitor Trends and Key Information About Competitors Include:
Grab: Grab remains the market leader, leveraging its super-app ecosystem that integrates ride-hailing, food delivery, digital payments, and financial services. Its competitive advantage lies in scale, regulatory alignment, data-driven pricing, and strong brand trust. Grab’s ability to cross-subsidize mobility through adjacent verticals allows it to maintain service coverage and driver incentives even during periods of regulatory or fuel cost pressure.
Angkas: Angkas is a pioneer and category leader in motorcycle ride-hailing, with strong brand recognition and a large rider base among daily commuters. The company differentiates itself through safety-focused positioning, rider training programs, and operational discipline. Angkas continues to play a critical role in shaping regulatory dialogue around motorcycle ride-hailing legitimacy and safety standards.
JoyRide: JoyRide has expanded rapidly by focusing on competitive pricing, aggressive driver onboarding, and service availability across both motorcycle and car-based ride-hailing. The platform competes strongly in price-sensitive segments and secondary cities, positioning itself as a viable alternative to dominant incumbents.
Move It: Move It has strengthened its market presence through integration within larger digital ecosystems, allowing it to benefit from shared user bases, payment infrastructure, and promotional reach. Its growth strategy emphasizes dense urban corridors and high-frequency commuter routes.
inDrive: inDrive differentiates itself through a peer-to-peer pricing model where riders and drivers negotiate fares. This approach appeals to cost-conscious users and drivers seeking pricing autonomy, although it faces scalability and regulatory scrutiny challenges in tightly governed urban markets.
OWTO: OWTO operates as a smaller, locally focused platform emphasizing community-based mobility solutions and niche route coverage. While limited in scale, it remains relevant in select urban pockets where localized demand patterns and driver familiarity offer competitive resilience.
What Lies Ahead for Philippines Ride-Sharing Services Market?
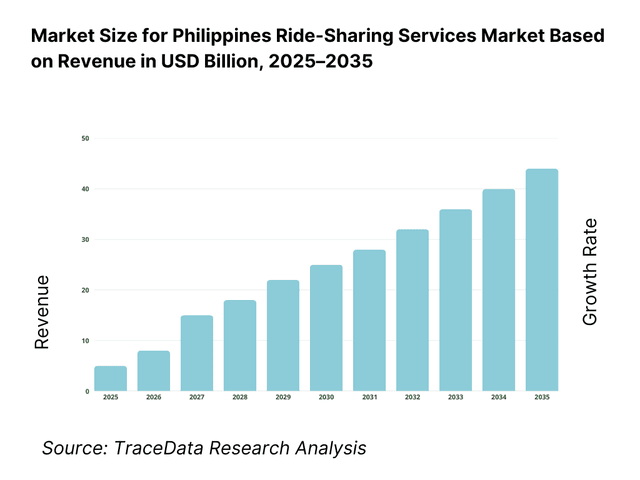
The Philippines ride-sharing services market is expected to expand steadily through 2035, supported by sustained urbanization, persistent congestion in major metros, and continued reliance on app-based mobility as a practical alternative to inconsistent public transport coverage. Growth momentum is further strengthened by rising smartphone and digital wallet penetration, greater comfort with on-demand services across income segments, and increasing adoption in secondary cities beyond Metro Manila. As commuters, travelers, and businesses continue to prioritize convenience, safety, and predictable availability, ride-sharing will remain a core mobility layer—especially for first/last-mile connectivity, time-sensitive travel, and corridor-based urban movement.
Transition Toward More Structured, Regulated, and Safety-Led Market Operations: The outlook period will see increasing formalization of ride-sharing through clearer accreditation processes, compliance tracking, and stronger passenger safety expectations. Platforms are expected to deepen driver verification, training, and monitoring systems while aligning product design with evolving regulatory requirements. As safety, accountability, and service quality become stronger decision factors—particularly for women riders, late-night users, and tourists—operators that demonstrate consistent compliance and transparent governance are likely to gain long-term trust and regulatory stability.
Growing Role of Motorcycle Ride-Hailing and Micro-Mobility as a Congestion Solution: Motorcycle ride-hailing will continue to be a structural growth engine due to its speed advantage in congested corridors and its affordability for daily commuting. Through 2035, demand will remain strong in dense city zones where travel time variability is the primary pain point. Platforms are expected to strengthen motorcycle supply density, route optimization, and rider safety features. In parallel, micro-mobility and short-hop mobility formats may expand selectively in high-density business districts and university corridors where short distance, rapid travel, and price sensitivity intersect.
Ecosystem Integration with Digital Payments, Food Delivery, and Logistics to Build Super-App Stickiness: Competitive advantage will increasingly be driven by ecosystem depth rather than standalone ride-hailing. Platforms will continue bundling mobility with food delivery, courier services, and wallet-based rewards to increase frequency of use and reduce customer acquisition costs. Loyalty programs, subscription bundles, and wallet-linked incentives are expected to expand, particularly for high-frequency commuters. Operators that integrate multi-service ecosystems and deliver consistent user experience across services will strengthen retention and pricing power over time.
Electrification Pilots, Fleet Partnerships, and Cost-Optimization Models to Improve Unit Economics: The economics of ride-sharing in the Philippines will remain sensitive to fuel prices, maintenance costs, and driver earnings sustainability. This will push platforms toward EV pilot programs, fleet partnerships, and financing tie-ups that reduce operating costs over the long term. While EV adoption will depend on charging availability and financing access, structured EV fleets in metro corridors, airport routes, and corporate mobility programs are expected to increase. Platforms that can build viable EV operating models—through incentives, leasing, and charging partnerships—will gain a cost advantage and a stronger sustainability narrative.
Philippines Ride-Sharing Services Market Segmentation
By Service Type
• Motorcycle Ride-Hailing
• Car Ride-Hailing
• Taxi Aggregation Services
• Premium / Corporate Ride Services
By Vehicle Category
• Motorcycles
• Sedans / Hatchbacks
• MPVs / SUVs
• Taxis (Accredited Fleet)
By Trip Purpose
• Daily Commuting & Personal Mobility
• Leisure, Social, & Tourism Travel
• Airport Transfers
• Corporate & Business Travel
By Pricing Model
• Pay-Per-Ride (On-Demand)
• Dynamic / Surge Pricing Variants
• Subscription & Corporate Packages
• Promotional / Bundled Pricing Models
By Region
• National Capital Region (Metro Manila)
• Luzon (Outside NCR)
• Visayas
• Mindanao
Players Mentioned in the Report:
• Grab
• Angkas
• JoyRide
• Move It
• inDrive
• Local and regional niche ride-hailing operators, taxi aggregators, and corporate mobility providers
Key Target Audience
• Ride-sharing platforms and super-app operators
• Motorcycle and car fleet owners / vehicle leasing companies
• Driver-partner communities and gig workforce aggregators
• Digital wallet providers and fintech partners
• Insurance providers offering passenger and driver coverage products
• Urban planners, transport authorities, and municipal regulators
• Corporate mobility buyers and travel management firms
• Investors and strategic partners in mobility, EV, and charging ecosystems
Time Period:
Historical Period: 2019–2024
Base Year: 2025
Forecast Period: 2025–2035
Explore Flexible Purchase Options or Have Limited Budget?
Pay only for relevant chapters • Customizable report sections
Table of Contents
Choose individual sections to purchase. Mix and match as you like.
4. 1 Delivery Model Analysis for Ride-Sharing Services including motorcycle ride-hailing, car ride-hailing, taxi aggregation, pooled/shared rides, and corporate mobility services with margins, preferences, strengths, and weaknesses
4. 2 Revenue Streams for Ride-Sharing Services Market including per-trip commissions, dynamic pricing premiums, subscription and corporate contracts, advertising and promotions, and bundled ecosystem revenues
4. 3 Business Model Canvas for Ride-Sharing Services Market covering platform operators, driver-partners, fleet owners, payment partners, insurance providers, mapping and technology partners, and regulatory bodies
5. 1 Global Ride-Sharing Platforms vs Regional and Local Players including Grab, inDrive, Angkas, JoyRide, Move It, and other domestic or regional operators
5. 2 Investment Model in Ride-Sharing Services Market including platform technology investments, driver incentive funding, fleet partnerships, EV pilots, and ecosystem expansion investments
5. 3 Comparative Analysis of Ride-Sharing Service Distribution by Direct-to-Consumer App-Based Booking and Corporate or Partner-Integrated Channels including wallet integrations and enterprise mobility tie-ups
5. 4 Consumer Transportation Budget Allocation comparing ride-sharing spend versus public transport, private vehicle ownership, taxis, and informal transport with average spend per user per month
8. 1 Revenues from historical to present period
8. 2 Growth Analysis by service type and by pricing model
8. 3 Key Market Developments and Milestones including regulatory updates, accreditation changes, platform launches, mergers or partnerships, and expansion into secondary cities
9. 1 By Market Structure including global platforms, regional platforms, and local players
9. 2 By Service Type including motorcycle ride-hailing, car ride-hailing, taxi aggregation, and premium or corporate services
9. 3 By Pricing Model including pay-per-ride, dynamic or surge pricing, subscription-based, and bundled or promotional models
9. 4 By User Segment including individual commuters, students, tourists, and corporate users
9. 5 By Consumer Demographics including age groups, income levels, and urban versus semi-urban users
9. 6 By Vehicle Type including motorcycles, sedans or hatchbacks, MPVs or SUVs, and taxis
9. 7 By Trip Type including daily commuting, leisure and social travel, airport transfers, and business travel
9. 8 By Region including National Capital Region (Metro Manila), Luzon (outside NCR), Visayas, and Mindanao
10. 1 Consumer Landscape and Cohort Analysis highlighting commuter dominance, youth users, and shift-worker mobility patterns
10. 2 Ride-Sharing Platform Selection and Purchase Decision Making influenced by pricing, waiting time, safety perception, vehicle type, and wallet integration
10. 3 Engagement and ROI Analysis measuring trip frequency, average fare, cancellation rates, and customer lifetime value
10. 4 Gap Analysis Framework addressing service availability gaps, pricing affordability, driver density, and platform differentiation
11. 1 Trends and Developments including growth of motorcycle ride-hailing, super-app ecosystems, EV pilots, and safety-led features
11. 2 Growth Drivers including urban congestion, public transport gaps, digital payments adoption, and gig workforce expansion
11. 3 SWOT Analysis comparing large super-app platforms versus local or niche ride-hailing operators
11. 4 Issues and Challenges including regulatory uncertainty, driver churn, fuel cost sensitivity, and service reliability constraints
11. 5 Government Regulations covering accreditation frameworks, driver and vehicle compliance, safety requirements, and transport governance in the Philippines
12. 1 Market Size and Future Potential of app-based mobility services and adjacent on-demand transport solutions
12. 2 Business Models including pure ride-hailing, super-app integration, fleet-led models, and hybrid mobility platforms
12. 3 Delivery Models and Type of Solutions including real-time matching, route optimization, wallet-linked payments, and safety and monitoring systems
15. 1 Market Share of Key Players by revenues and by trip volumes
15. 2 Benchmark of Key Competitors including Grab, Angkas, JoyRide, Move It, inDrive, and other regional or local ride-sharing operators
15. 3 Operating Model Analysis Framework comparing super-app ecosystems, motorcycle-focused platforms, and price-negotiation-based models
15. 4 Gartner Magic Quadrant positioning global mobility platforms and regional challengers in ride-sharing services
15. 5 Bowman’s Strategic Clock analyzing competitive advantage through service differentiation, pricing flexibility, and ecosystem-led strategies
16. 1 Revenues with projections
17. 1 By Market Structure including global platforms, regional platforms, and local players
17. 2 By Service Type including motorcycle, car, taxi aggregation, and premium services
17. 3 By Pricing Model including pay-per-ride, dynamic pricing, subscription, and bundled offerings
17. 4 By User Segment including individuals, commuters, tourists, and corporate users
17. 5 By Consumer Demographics including age and income groups
17. 6 By Vehicle Type including motorcycles, cars, and taxis
17. 7 By Trip Type including daily commute, leisure, airport, and business travel
17. 8 By Region including National Capital Region, Luzon (outside NCR), Visayas, and Mindanao
Discuss a Customized Research Scope
Custom research scope • Tailored insights • Industry expertise
Research Methodology
Step 1: Ecosystem Creation
We begin by mapping the complete ecosystem of the Philippines Ride-Sharing Services Market across demand-side and supply-side entities. On the demand side, entities include daily urban commuters, students, office-goers, BPO and shift workers, tourists, airport travelers, corporate travel users, and price-sensitive mass-market riders who use motorcycle ride-hailing for time savings. Demand is further segmented by trip purpose (commute vs leisure vs airport vs corporate), time-of-day (peak vs off-peak), service preference (motorcycle vs car vs taxi aggregation), and booking behavior (single-user, repeat users, wallet-linked users). On the supply side, the ecosystem includes ride-sharing platforms and super-app operators, driver-partners (motorcycle and car), fleet owners and leasing operators, financing partners (banks, NBFCs, and vehicle loan providers), insurance providers, digital wallet and payment partners, mapping/navigation providers, customer support and safety operations teams, and government regulators and enforcement bodies overseeing accreditation and compliance. From this mapped ecosystem, we shortlist 6–10 key platforms and aggregators and a representative set of fleet/driver categories based on market presence in NCR and major secondary cities, service portfolio breadth (motorcycle/car/taxi), user base scale, and regulatory compliance track record. This step establishes how value is created and captured across acquisition, matching, pricing, fulfillment, safety assurance, payments, and partner ecosystems.
Step 2: Desk Research
An exhaustive desk research process is undertaken to analyze the Philippines ride-sharing market structure, demand drivers, and segment behavior. This includes reviewing urban mobility patterns, congestion intensity by city, public transport coverage gaps, commuter time-cost tradeoffs, smartphone and e-wallet penetration trends, and platform adoption dynamics across income segments. We assess user preferences around convenience, safety, waiting times, affordability, and reliability, along with platform-level positioning across motorcycle and car-based services. Company-level analysis includes review of service offerings, pricing logic, incentive structures, driver onboarding processes, fleet partnerships, safety features, and ecosystem bundling (mobility + food delivery + wallet). We also examine the regulatory and compliance environment shaping supply availability, including accreditation structures, vehicle eligibility, documentation requirements, and enforcement variability across jurisdictions. The outcome of this stage is a comprehensive industry foundation that defines the segmentation logic and creates the assumptions needed for market estimation and outlook modeling through 2035.
Step 3: Primary Research
We conduct structured interviews with ride-sharing platform teams, driver-partners (motorcycle and car), fleet owners/leasing operators, insurance partners, corporate mobility buyers, and high-frequency users across Metro Manila and priority secondary cities. The objectives are threefold: (a) validate assumptions around demand concentration by city and trip purpose, (b) authenticate segment splits by service type, vehicle category, and pricing model, and (c) gather qualitative insights on driver economics, incentive sustainability, surge pricing sensitivity, cancellation behavior, safety perceptions, and service quality drivers. A bottom-to-top approach is applied by estimating active driver supply, average trips per driver per day, average fare per trip, and platform take-rate ranges across service types, which are aggregated to develop the overall market view. In selected cases, disguised rider-style booking tests are conducted across time windows (peak/off-peak) and corridors (CBDs, transport terminals, airports) to validate field realities such as waiting times, surge frequency, cancellation rates, and availability gaps between motorcycle and car services.
Step 4: Sanity Check
The final stage integrates bottom-to-top and top-to-down approaches to cross-validate the market view, segmentation splits, and forecast assumptions. Demand estimates are reconciled with macro indicators such as urban population growth, employment concentration in NCR and major cities, commuting intensity, transport infrastructure rollout trajectories, and digital payments adoption. Assumptions around fuel price sensitivity, driver churn rates, regulatory tightening or liberalization, and platform incentive intensity are stress-tested to understand their impact on service availability and fare levels. Sensitivity analysis is conducted across key variables including congestion severity, regulatory caps on accredited vehicles, EV adoption pace, and secondary city penetration. Market models are refined until alignment is achieved between platform-level supply scalability, fleet economics, and city-level demand corridors, ensuring internal consistency and robust directional forecasting through 2035.
See What's Inside the Report
Get a preview of key findings, methodology and report coverage
Frequently Asked Questions
The Philippines ride-sharing services market holds strong potential, supported by persistent congestion in major cities, structural public transport gaps, and rising consumer preference for convenient, app-based point-to-point mobility. Motorcycle ride-hailing is expected to remain a structural growth engine due to affordability and speed advantages, while car-based ride-hailing will expand steadily in airport transfers, family travel, and corporate mobility. As digital wallets, ecosystem bundling, and service reliability improve, ride-sharing is expected to deepen penetration beyond NCR and scale across secondary urban centers through 2035.
The market is characterized by a small number of dominant super-app and ride-hailing platforms supported by expanding local motorcycle ride-hailing operators and taxi aggregators. Competition is shaped by driver supply density, regulatory compliance capability, pricing discipline, safety positioning, and ecosystem integration (payments, delivery, loyalty programs). Fleet partnerships and driver onboarding capability play a central role in sustaining availability and improving service reliability across cities.
Key growth drivers include urban congestion and time unpredictability, limited coverage and reliability of public transport, growing smartphone and e-wallet adoption, and the expanding gig workforce supply base. Additional momentum comes from platform ecosystem bundling, loyalty programs, and the rising acceptance of motorcycle ride-hailing as a practical commuting alternative. Through 2035, secondary city expansion, corporate mobility demand, and gradual electrification pilots are expected to strengthen market maturity and value capture.
Challenges include regulatory uncertainty and enforcement variability, driver supply volatility driven by earnings pressure and fuel costs, and service inefficiencies caused by congestion and infrastructure constraints. Platform economics remain sensitive to incentive intensity, surge pricing acceptance, and cancellation rates during peak periods. In certain cities, limited pickup/drop-off management and localized compliance constraints can also reduce service predictability and slow geographic expansion.
License Options
PDF + Excel
Complete report package
$4,000
Excel Only
Data and analytics
$2,500
Custom Sections
Starts from $100
$0