Qatar Education Market Outlook to 2030
By Sector, By Ownership Type, By Curriculum, By Learner Cohort, and By Region
Report Overview
Report Code
TDR0339
Coverage
Middle East
Published
October 2025
Pages
80
Flexible Purchase Options
Select and purchase only the chapters you need for your strategic decisions
On This Page
Report Overview
The report titled “Qatar Education Market Outlook to 2030 – By Sector, By Ownership Type, By Curriculum, By Learner Cohort, and By Region” provides a comprehensive analysis of the education sector in Qatar. The report covers an overview and genesis of the industry, overall market size in terms of revenue and enrollment, market segmentation; trends and developments, regulatory and licensing landscape, student and parent-level profiling, issues and challenges, and competitive landscape including competition scenario, cross-comparison parameters, opportunities and bottlenecks, and detailed company profiling of major players in the Qatar education market.
Report Coverage
Verified Market Sizing
Multi-layer forecasting with historical data and 5–10 year outlook
Deep-Dive Segmentation
Cross-sectional analysis by product type, end user, application and region
Competitive Benchmarking & Positioning
Market share, operating model, pricing and competition matrices
Actionable Insights & Risk Assessment
High-growth white spaces, underserved segments, technology disruptions and demand inflection points
Review Methodology & Data Structure
Preview report structure, data sources and research framework
Executive Summary
The report titled “Qatar Education Market Outlook to 2030 – By Sector, By Ownership Type, By Curriculum, By Learner Cohort, and By Region” provides a comprehensive analysis of the education sector in Qatar. The report covers an overview and genesis of the industry, overall market size in terms of revenue and enrollment, market segmentation; trends and developments, regulatory and licensing landscape, student and parent-level profiling, issues and challenges, and competitive landscape including competition scenario, cross-comparison parameters, opportunities and bottlenecks, and detailed company profiling of major players in the Qatar education market. The report concludes with future market projections based on student enrollments, tuition revenue, curriculum share, geographic expansion, and cause-and-effect relationships, along with success case studies highlighting the major opportunities and cautions for investors, operators, and policymakers.
Qatar Education Market Overview and Size
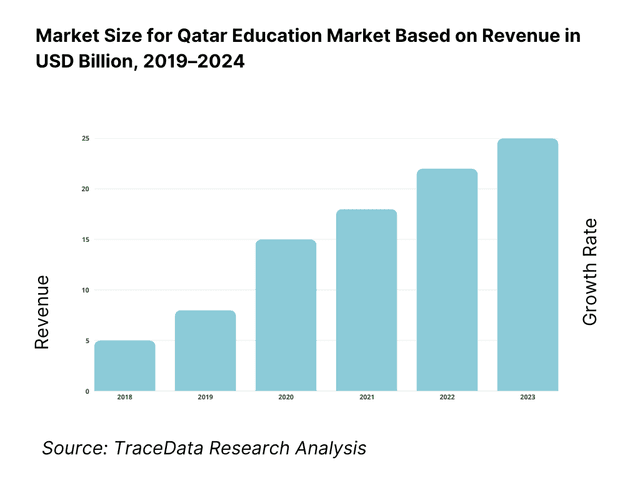
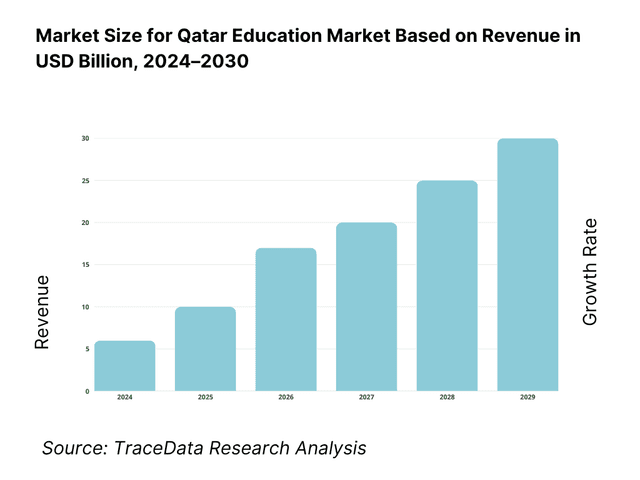
The Qatar Education Market is valued at USD 7.5 billion, based on a multi-year assessment of the country’s public and private education ecosystem. Structural drivers underpinning this size include sustained public outlays—USD 4.9 billion allocated to education in the national budget—and policy continuity focused on human capital under Qatar National Vision. In the current fiscal cycle, overall state spending totals USD 55.4 billion, with education and health jointly prioritized, reinforcing sector liquidity and capex pipelines for capacity, teacher quality and accreditation.
Doha dominates the Qatar Education Market due to the dense concentration of premium international schools and the Education City cluster of global branch campuses (e.g., Georgetown University in Qatar; Weill Cornell Medicine–Qatar), creating a powerful pipeline for K-12-to-tertiary progression and research linkages. Neighboring Al Rayyan and Al Daayen/Lusail are growth corridors, benefiting from land availability and planned community infrastructure that supports new campuses and blended-learning facilities. This dominance is reinforced by the national focus on a knowledge economy and the Qatar Foundation ecosystem.
What Factors are Leading to the Growth of the Qatar Education Market:
Population inflows and education demand concentration: Qatar’s resident population reached 2,858,000 in mid-year readings, up from 2,656,000 a year earlier, adding 202,000 people within the period—an increase driven mainly by inbound workers and dependents concentrated in Greater Doha, where most K-12 and tertiary capacity sits. Net migration recorded 46,105 people, reinforcing sustained demand for international curricula and university pathways. Education City anchors tertiary progression with 8 partner universities, creating a strong K-12→HE funnel and stabilizing private enrollment across premium schools. These concurrent data points collectively underpin classroom demand, bus networks, and faculty recruitment pipelines.
National income capacity and household ability to pay for schooling: Macroeconomic capacity supports education outlays and capex. IMF shows Qatar’s economy at USD 222.78 billion (current prices) and GDP per capita at USD 71,650, maintaining high household purchasing power and enabling investment in premium K-12, TVET, and university programs, plus teacher recruitment and campus upgrades. This income backdrop helps sustain multi-campus operators and accelerates adoption of resource-intensive pathways (AP, IB, A-Level) which require labs, specialist staff, and advising services—critical for continuity of demand in Doha, Al Rayyan and Lusail corridors.
Tertiary hub effects increasing progression and skills pathways: Education City hosts 8 international universities—Carnegie Mellon, Georgetown, Hamad Bin Khalifa University, HEC Paris, Northwestern, Texas A&M (wind-down decision announced separately), VCUarts, and Weill Cornell Medicine—creating clear progression routes and research exposure that elevate demand for IB, American and British tracks at K-12. Parallel public data portals list institution-level enrollment datasets for Qatar’s tertiary sector, enabling operators to align program capacity with observed student flows across Qatari and non-Qatari cohorts. The clustering effect of 8 universities also concentrates scholarship programs and internship pipelines in Doha.
Which Industry Challenges Have Impacted the Growth of the Qatar Education Market:
Demographic volatility complicating seat planning and staffing: Monthly readings show Qatar’s resident population moving from 2,704,000 to 2,788,000 over a single comparison month a year apart, and separately from 2,656,000 to 2,858,000 over another mid-year basis—swings of 84,000 and 202,000 respectively. Such rapid changes raise complexities in admissions forecasting, transport routing, and teacher headcount planning, especially for Doha-centric premium schools that operate near capacity. Operators must buffer for intake spikes tied to project hiring cycles, with knock-on effects on class sizes, temporary classrooms, and school-bus procurement.
Migration-dependent labor market elevates recruitment and retention risk: World Bank records 46,105 net migrants, evidencing a workforce that is highly international. While this sustains demand for international curricula, it also means schools rely on overseas teacher pipelines exposed to visa timing and global mobility cycles. Working-age population ratios (World Bank age-structure indicators) underscore a labor market dominated by the 15–64 cohort, increasing competition for skilled educators across sectors. This dynamic pressures HR to maintain rolling recruitment, credential verification, and induction cycles calibrated to academic calendars.
Uneven geographic distribution of schools requires new-builds beyond Doha: Official open-data portals list municipal-level school counts and time series, showing concentration in Doha municipalities relative to southern and northern corridors. The “Number of Schools by Municipality and Year” dataset and the “Number of Schools by Type of School and Year” dataset point to capacity clustering that necessitates greenfield builds in Al Wakrah, Al Daayen/Lusail and Umm Salal/Al Khor/Al Shamal to match residential growth. Operators planning transport fleets and catchment areas must align with these counts to avoid under-served zones and long commute times.
What are the Regulations and Initiatives which have Governed the Market:
MOEHE licensing windows and curriculum obligations: The Ministry of Education and Higher Education requires private-school license applications to be submitted in November and December annually via the Private Schools Licensing channel. The official Licensing Handbook specifies academic requirements, including a minimum of 4 weekly lesson hours for Arabic in relevant streams and teacher qualification thresholds across Grades 1–12 for Arabic delivery. These numeric conditions shape timetable design, staffing plans, and compliance audits for new and expanding schools.
Data privacy compliance for student records: Qatar’s Personal Data Privacy Protection Law No. 13 of 2016 governs the collection, processing and transfer of personal data—including student admissions files, assessments and health records—requiring transparency and lawful bases. The National Cyber Security Agency hosts the official English text and guidance, and schools must align LMS and SIS workflows, consent forms, and retention schedules with the law’s provisions; non-compliance can trigger regulatory action under the statute.
Statutory framework regulating private schools: Law No. 23 of 2015 regulates private schools from kindergarten through secondary, setting licensing procedures, compliance obligations and governance requirements. The MOEHE licensing page confirms licensing is issued under Law 23, while official communications record promulgation by the Amiri Diwan. Operators must align founding documents, governance structures, and day-to-day operations to the law’s articles, with licensing terms applied across K-12 levels.
Qatar Education Market Segmentation
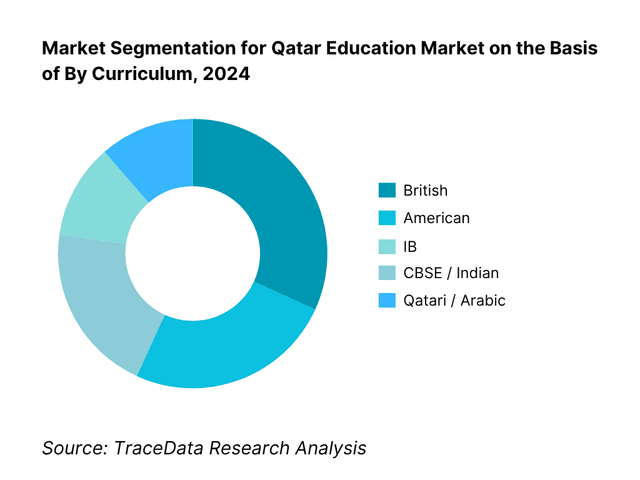
By Curriculum: Qatar Education Market is segmented by curriculum into British, American, IB, CBSE/Indian, Qatari/Arabic and Others. Recently, British curriculum has a dominant market share in Qatar under the segmentation by curriculum, owing to longstanding parent familiarity with IGCSE/A-Level pathways, abundant teacher supply from established networks, and strong university acceptance in the UK and Commonwealth. Leading brands such as Doha College, Doha British School, Park House English School, and Compass International have deep reputations and alumni success, reinforcing high occupancy and pricing power. In parallel, American and IB tracks continue to expand—anchored by American School of Doha and IB World Schools—as parents seek North American admissions flexibility and inquiry-based pedagogy.
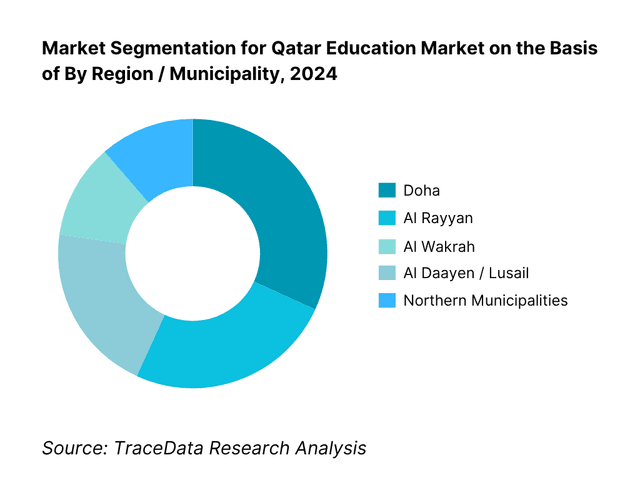
By Region / Municipality: Qatar Education Market is segmented by region into Doha, Al Rayyan, Al Wakrah, Al Daayen/Lusail, and Northern Municipalities. Recently, Doha has a dominant market share in Qatar under the segmentation by region, due to its concentration of international schools, proximity to major employment hubs, and superior transport connectivity which lowers commute friction for families. The clustering effect around Education City further amplifies appeal via university pathways, extracurricular breadth, and research linkages. Al Rayyan and Lusail are expanding, driven by master-planned residential growth, new school plots, and investor appetite for greenfield campuses positioned at mid- and premium fee bands.
Competitive Landscape in Qatar Education Market
The Qatar Education Market features a concentrated premium K-12 segment and a unique higher-education hub anchored by Education City. International operators (e.g., GEMS and SABIS) coexist with legacy institutions (e.g., Doha College) and Qatar Foundation schools. Branch campuses (e.g., Georgetown University in Qatar and Weill Cornell Medicine–Qatar) elevate tertiary quality, spur research collaboration, and drive demand for advanced STEM and pre-med tracks. This blend of global brands and local champions shapes pricing, pedagogy, and accreditation standards across the market.
Name | Founding Year | Original Headquarters |
GEMS Education | 1959 | Dubai, United Arab Emirates |
SABIS Education Services | 1886 | Choueifat/Adma, Lebanon |
Doha College | 1980 | Doha, Qatar |
Doha British School | 1997 | Doha, Qatar |
American School of Doha | 1988 | Doha, Qatar |
Qatar Academy (Qatar Foundation) | 1996 | Doha, Qatar |
Compass International School | 2006 | Doha, Qatar |
Newton International School | 2006 | Doha, Qatar |
Park House English School | 1994 | Doha, Qatar |
International School of London Qatar | 2008 | London, United Kingdom |
Arab International Academy | 2016 | Doha, Qatar |
The Phoenix Private School | 2013 | Doha, Qatar |
Blyth Academy Qatar | 2010 | Toronto, Canada |
Georgetown University in Qatar | 2005 | Washington, DC, US |
Weill Cornell Medicine–Qatar | 2001 | New York, United States |
Some of the Recent Competitor Trends and Key Information About Competitors Include:
GEMS Education: As one of the largest private school operators in the region, GEMS has strengthened its footprint in Qatar by investing in premium British curriculum schools in Doha. In 2024, the group introduced advanced STEM labs and digital platforms, aligning with parent demand for future-ready education.
SABIS Education Services: With deep roots in the Middle East, SABIS has focused on expanding its blended-learning solutions in Qatar. In 2024, SABIS rolled out a centralized digital assessment platform across its Doha schools, improving real-time performance monitoring and student engagement.
Doha College: One of Qatar’s most established British curriculum schools, Doha College opened a state-of-the-art Al Wajba campus with expanded facilities for science, sports, and performing arts. The new site underscores its strategy to sustain leadership in premium K-12 education.
American School of Doha (ASD): ASD reported strong enrollment growth in 2024, especially among expatriate families seeking continuity with North American curricula. The school has enhanced its Advanced Placement (AP) offerings and invested in new faculty development programs to boost teaching quality.
Qatar Academy (Qatar Foundation): As part of the Education City ecosystem, Qatar Academy continues to focus on the International Baccalaureate (IB) framework. In 2024, it deepened collaboration with branch universities in Education City, strengthening student progression pathways into higher education and research programs.
What Lies Ahead for Qatar Education Market?
The Qatar education market is expected to maintain steady expansion towards the end of the decade, supported by consistent government allocations to human development, a high-income population that prioritizes premium schooling, and the strategic role of Education City in driving higher-education and research linkages. The sector’s evolution will be defined by demographic stability, technological integration, and ongoing diversification of curricula to meet international university admissions standards.
Rise of Hybrid and Blended Learning Models: The future of the Qatar education market is likely to see an increasing shift towards hybrid learning models, integrating online platforms with classroom instruction. This change is driven by the country’s advanced digital infrastructure, widespread device adoption, and post-pandemic acceptance of blended education. Such models provide flexibility for both K-12 and tertiary students, improve accessibility for remote municipalities like Al Wakrah and Al Daayen, and allow schools to maintain continuity during disruptions while scaling enrichment programs.
Emphasis on Outcome-Based Education: With parents and regulators emphasizing accountability, there will be a stronger focus on measurable learning outcomes in the Qatar education market. Schools are increasingly expected to demonstrate university progression rates, standardized test performance, and skill-readiness indicators aligned with Qatar National Vision. This outcome-centric approach ensures that curriculum delivery is tied to tangible academic and career progression, especially for expatriate families seeking international university placement and Qatari nationals targeted for strategic sectors like healthcare, ICT, and energy.
Expansion of Specialized Programs and Pathways: Sector-specific education programs are poised to expand in Qatar, particularly in vocational and higher education aligned with industries central to the economy such as oil & gas, finance, ICT, and hospitality. Vocational institutions and universities are introducing specialized certifications, professional diplomas, and STEM pathways to address skills shortages. The focus on applied learning will deepen partnerships between schools, universities, and employers, strengthening the labor pipeline and enhancing employability of graduates in both national and expatriate cohorts.
Leveraging AI, Data, and EdTech: The role of AI and advanced analytics is expected to grow in Qatar’s education market, enabling personalized learning, predictive performance analysis, and adaptive teaching support. Schools and universities are increasingly integrating smart learning management systems (LMS) that track student engagement and outcomes in real-time. EdTech adoption also enhances transparency for parents, supports differentiated instruction, and aligns with regulatory requirements for monitoring quality. These innovations are set to improve learning efficiency and return on investment in educational infrastructure.
Qatar Education Market Segmentation
By Sector
Pre-Primary / Kindergarten
Primary Schools
Preparatory / Middle Schools
Secondary / High Schools
Higher Education (public universities, international branch campuses, private colleges)
Vocational & Technical Training (TVET)
EdTech & Online Learning
Test-Preparation Services
By Ownership / Institution Type
Public / Government Schools
Private International Schools
Community / National Schools (e.g., Indian, Filipino, Pakistani)
University Branch Campuses (Education City institutions such as Georgetown, Weill Cornell, Carnegie Mellon)
Private Vocational / Training Centers
By Curriculum
British (IGCSE / A-Level)
American (AP, High School Diploma)
International Baccalaureate (IB)
CBSE / Indian Curriculum
Qatari / Arabic National Curriculum
Other Curricula (French, German, etc.)
By Learner Cohort
Qatari Nationals
Expatriates
Gender Split
By Geography / Municipality
Doha Municipality
Al Rayyan
Al Wakrah
Al Daayen / Lusail
Northern Municipalities
Players Mentioned in the Report:
GEMS Education
SABIS Education Services
Doha College
Doha British School
American School of Doha
Qatar Academy (Qatar Foundation)
Compass International School
Newton International School
Park House English School
International School of London Qatar
Arab International Academy
The Phoenix Private School
Blyth Academy Qatar
Georgetown University in Qatar
Weill Cornell Medicine–Qatar
Key Target Audience
Private equity funds and investment/venture capital firms (growth capital for K-12, TVET, EdTech)
Government and regulatory bodies (Ministry of Education and Higher Education – MOEHE; Ministry of Finance – MOF; Qatar Free Zones Authority – QFZA)
Real-estate developers and school operators (OpCo–PropCo, REIT structures)
University branch-campus administrators and international admissions consortia
Corporate HR and L&D heads (enterprise upskilling; scholarship partners)
Technology/LMS vendors and content publishers (K-12, TVET, higher-ed)
Transport, facilities management, and school services providers
Scholarship funds and philanthropic foundations active in education
Time Period:
Historical Period: 2019-2024
Base Year: 2025
Forecast Period: 2025-2030
Explore Flexible Purchase Options or Have Limited Budget?
Pay only for relevant chapters • Customizable report sections
Table of Contents
Choose individual sections to purchase. Mix and match as you like.
4.1 Delivery Model Analysis-On-Campus, Online, Blended, Self-Paced (margins by model, parent/student preference, pedagogy strengths, operational weaknesses, accreditation implications)
4.2 Revenue Streams for Qatar Education Market (tuition & fees, transportation, uniforms/books, activities, sponsorships, endowments, ancillary services, corporate training arms)
4.3 Business Model Canvas for Qatar Education Market (value proposition, key resources, key partners, cost structure, channels, customer segments, revenue logic)
5.1 Adjunct/Visiting Faculty vs. Full-Time Faculty (teacher-student ratios, compensation benchmarks, retention, quality outcomes)
5.2 Investment Models in Qatar Education (greenfield, brownfield, PPPs, franchise/curriculum licensing, REIT/OpCo-PropCo splits)
5.3 Comparative Analysis of the Admissions Funnel-Public vs. Private Institutions (lead gen → inquiry → assessment → offer → enrollment → retention KPIs)
5.4 Education Budget Allocation by Institution Size (budget heads by small, mid, large schools/universities; opex vs. capex, digital spend, scholarships)
8.1 Revenues (total market; K-12 private/public, higher education, vocational, EdTech, test-prep; USD/QAR)
9.1 By Market Structure (public, private, PPP/charter, branch campuses)
9.2 By Education Type (pre-primary, primary, preparatory, secondary, higher education, vocational/TVET, EdTech/test-prep)
9.3 By Curriculum (British, American, IB, CBSE/Indian, Qatari/Arabic, others)
9.4 By Institution Size (small, medium, large by enrollment bands)
9.5 By Learner Cohort (Qatari nationals, expatriates by major nationality clusters; gender split)
9.6 By Mode of Learning (on-campus, blended, online, self-paced; synchronous vs. asynchronous)
9.7 By Program Type (open admissions vs. selective; standardized vs. customized special tracks/G&T/SEN)
9.8 By Region/Municipality (Doha, Al Rayyan, Al Wakrah, Al Daayen/Lusail, Umm Salal/Al Khor/Al Shamal)
10.1 Parent/Student & Corporate Client Landscape and Cohort Analysis (income bands, nationality clusters, program preferences, willingness to pay)
10.2 Decision-Making Process (curriculum choice drivers, location & transport, accreditation, extracurriculars, university pathways)
10.3 Program Effectiveness & ROI Analysis (learning outcomes, progression to tertiary, graduate employability, scholarship impact)
10.4 Gap Analysis Framework (unmet demand by curriculum/region/fee tier; SEN provision; TVET alignment to labor needs)
11.1 Trends & Developments (IB/US growth, Doha saturation vs. southern corridors, EdTech penetration, Lusail campus clustering)
11.2 Growth Drivers (demographics, expatriate inflows, Vision 2030 human development pillar, income resilience, PPP support)
11.3 SWOT Analysis (by K-12, higher ed, vocational, EdTech)
11.4 Issues & Challenges (land & capex intensity, teacher recruitment/retention, accreditation compliance, fee regulation)
11.5 Government Regulations (licensing, accreditation standards, data/privacy for EdTech, gender & language policies, scholarships)
12.1 Market Size & Future Potential (digital K-12 supplements, higher-ed online programs, corporate/TVET e-learning)
12.2 Business Models & Revenue Streams (subscription, per-course, institutional licensing, B2B partnerships)
12.3 Delivery Models & Course Types (credit-bearing, micro-credentials, test-prep, language, STEM, professional upskilling)
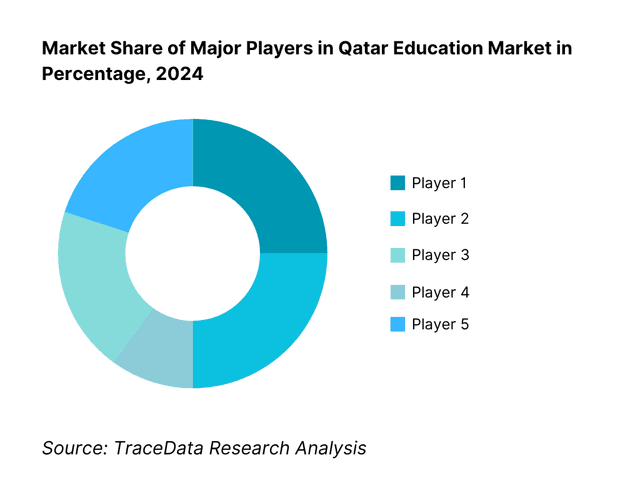
15.1 Market Share of Key Players (by enrollment and revenue-private K-12 & higher ed)
15.2 Benchmark of Key Competitors (company overview, USP, strategy, business model, number of teachers/faculty, revenues, pricing by stage, tech stack/LMS, best-selling programs, major clients/feeder schools, partnerships, marketing, recent developments)
15.3 Operating Model Analysis Framework (admissions engine, timetable & staffing, procurement, transport, pastoral/CX, quality & inspection readiness)
15.4 Gartner-Style Quadrant (vision vs. execution among operators and EdTech vendors)
15.5 Bowman’s Strategic Clock (price-value positioning across fee tiers & curricula)
16.1 Revenues (total and by segment; sensitivity scenarios)
17.1 By Market Structure (public, private, PPP/charter, branch campuses)
17.2 By Education Type (pre-primary, primary, preparatory, secondary, higher education, vocational/TVET, EdTech/test-prep)
17.3 By Curriculum (British, American, IB, CBSE/Indian, Qatari/Arabic, others)
17.4 By Institution Size (small, medium, large by enrollment bands)
17.5 By Learner Cohort (nationals vs. expatriates; gender split)
17.6 By Mode of Learning (on-campus, blended, online, self-paced)
17.7 By Program Type (open admissions vs. selective; standardized vs. customized special tracks/G&T/SEN)
17.8 By Region/Municipality (Doha, Al Rayyan, Al Wakrah, Al Daayen/Lusail, Umm Salal/Al Khor/Al Shamal)
Discuss a Customized Research Scope
Custom research scope • Tailored insights • Industry expertise
Research Methodology
Step 1: Ecosystem Creation
Map the ecosystem and identify all the demand-side and supply-side entities for the Qatar Education Market. On the demand side, this includes Qatari nationals, expatriate families, and corporate scholarship programs, while the supply side spans K-12 operators, international schools, universities in Education City, vocational/TVET institutions, and EdTech providers. Based on this ecosystem, we shortlist 5–6 leading education providers in Qatar, such as Doha College, American School of Doha, GEMS Education, SABIS, and Qatar Academy, evaluating them by financial information (tuition revenues), market reach (Doha vs. regional municipalities), and student base (enrollments). Sourcing is conducted through official government portals (MOEHE, Planning & Statistics Authority), institutional reports, and secondary databases to collate sector-level information.
Step 2: Desk Research
An exhaustive desk research process is then undertaken by referencing diverse secondary and government datasets, supplemented with proprietary education databases. This approach enables a thorough analysis of the Qatar Education Market, aggregating insights such as the total number of schools and universities, curriculum distribution, enrollment data, and demographic variables. We supplement this with detailed examinations of company-level data through press releases, annual reports, financial disclosures, and operator websites. The outcome of this step is a foundational understanding of sector revenues, player strategies, and value chain linkages, especially in premium K-12 and Education City institutions.
Step 3: Primary Research
In-depth interviews are initiated with school directors, university administrators, and EdTech executives, as well as end-user parents and scholarship fund representatives. This interview process validates market hypotheses, authenticates statistical data, and extracts valuable operational insights. A bottom-up approach is undertaken to assess revenue contributions by individual operators and aggregate to the overall market. As part of the validation strategy, disguised interviews are conducted where the research team approaches institutions under the guise of potential parent clients. This enables validation of fee ranges, occupancy, and teacher–student ratios, corroborating this information with secondary datasets. These interactions provide a full understanding of tuition revenue streams, academic pathways, governance, and accreditation processes.
Step 4: Sanity Check
A top-down and bottom-up analysis is executed, triangulating national budget allocations (USD 4.9 billion for education), enrollment counts, and tuition-fee bands with bottom-up school-level data. This modeling exercise ensures that the final market size is consistent across macroeconomic data, government allocations, and operator disclosures. Sanity checks are performed to confirm accuracy in reported enrollment shares (Doha 61%, Al Rayyan 16%) and curriculum split (British, American, IB, CBSE/Indian, Arabic), ensuring reliability of the research output.
See What's Inside the Report
Get a preview of key findings, methodology and report coverage
Frequently Asked Questions
The Qatar Education Market holds substantial potential, with strong government commitment evidenced by USD 4.9 billion allocated to education in the national budget and a resident population of 2.85 million driving continuous demand for schooling and higher education. The market is supported by premium K-12 schools, vocational and technical institutions, and the globally recognized Education City, which hosts 8 international universities. The emphasis on human capital under Qatar National Vision further underpins the sector’s role as a strategic pillar in national development.
The Qatar Education Market features several prominent players, including GEMS Education, SABIS Education Services, Doha College, American School of Doha, and Qatar Academy (Qatar Foundation). These institutions dominate the market through strong curriculum offerings, international accreditation, and established reputations among both expatriate and Qatari families. Other notable names include Compass International School, Newton International School, Park House English School, International School of London Qatar, Arab International Academy, The Phoenix Private School, Blyth Academy Qatar, Georgetown University in Qatar, and Weill Cornell Medicine–Qatar.
The main growth drivers include Qatar’s sustained fiscal strength, with GDP per capita standing at USD 71,650 according to the IMF, enabling high household investment in education. Rising expatriate inflows, reflected in a resident population of 2.85 million, create steady demand for international schools and premium curricula. The presence of 8 international universities within Education City enhances progression pathways, while government prioritization of education as part of Vision 2030 ensures that resources and reforms continue to reinforce sector growth.
Challenges include demographic volatility, with monthly population changes of over 80,000–200,000 people making school capacity and teacher planning complex. Teacher recruitment is also constrained by reliance on international inflows, as shown by net migration of 46,105 people, creating HR and visa timing pressures. Finally, regulatory oversight is intensive: private schools must obtain licenses under Law No. 23 of 2015, with the MOEHE mandating conditions such as a minimum of 4 weekly Arabic lessons. These regulatory and demographic complexities present operational challenges for institutions.
License Options
PDF + Excel
Complete report package
$4,000
Excel Only
Data and analytics
$2,500
Custom Sections
Starts from $100
$0