Saudi Arabia Logistics and Warehousing Market Outlook to 2029
By Market Structure, By Mode of Transport, By Type of Warehousing, By End-User Industries, and By Region
Report Overview
Report Code
TDR0197
Coverage
Middle East
Published
June 2025
Pages
80
Flexible Purchase Options
Select and purchase only the chapters you need for your strategic decisions
On This Page
Report Overview
The report titled “Saudi Arabia Logistics and Warehousing Market Outlook to 2029 – By Market Structure, By Mode of Transport, By Type of Warehousing, By End-User Industries, and By Region” provides a comprehensive analysis of the logistics and warehousing market in Saudi Arabia. The report covers an overview and genesis of the industry, overall market size in terms of revenue, market segmentation; trends and developments, regulatory landscape, customer-level profiling, issues and challenges, and comparative landscape including competition scenario, cross comparison, opportunities and bottlenecks, and company profiling of major players in the Saudi logistics and warehousing market.
Report Coverage
Verified Market Sizing
Multi-layer forecasting with historical data and 5–10 year outlook
Deep-Dive Segmentation
Cross-sectional analysis by product type, end user, application and region
Competitive Benchmarking & Positioning
Market share, operating model, pricing and competition matrices
Actionable Insights & Risk Assessment
High-growth white spaces, underserved segments, technology disruptions and demand inflection points
Review Methodology & Data Structure
Preview report structure, data sources and research framework
Executive Summary
The report titled “Saudi Arabia Logistics and Warehousing Market Outlook to 2029 – By Market Structure, By Mode of Transport, By Type of Warehousing, By End-User Industries, and By Region” provides a comprehensive analysis of the logistics and warehousing market in Saudi Arabia. The report covers an overview and genesis of the industry, overall market size in terms of revenue, market segmentation; trends and developments, regulatory landscape, customer-level profiling, issues and challenges, and comparative landscape including competition scenario, cross comparison, opportunities and bottlenecks, and company profiling of major players in the Saudi logistics and warehousing market. The report concludes with future market projections based on revenue by segment, mode of transport, end-use industries, region-wise demand, cause and effect relationships, and success case studies highlighting major opportunities and risks.
Saudi Arabia Logistics and Warehousing Market Overview and Size
The Saudi Arabia logistics and warehousing market was valued at SAR 75 Billion in 2023, driven by government-led infrastructure investments, the growth of e-commerce, and increasing demand from the FMCG, retail, and industrial sectors. The market is characterized by key players such as Bahri Logistics, Almajdouie Logistics, Agility Logistics, Aramex, and Naqel Express. These companies are known for their strong transportation networks, integrated warehousing services, and strategic geographic presence across the Kingdom.
In 2023, Bahri Logistics expanded its inland transport and storage operations to support Vision 2030 goals and enhance supply chain efficiencies for the manufacturing and retail sectors. Riyadh and Jeddah remain major logistics hubs owing to their concentration of industrial activity and proximity to major seaports and airports.
Market Size for Saudi Arabia Logistics and Warehousing Industry on the Basis of Revenue in USD Billion, 2018-2024

What Factors are Leading to the Growth of the Saudi Arabia Logistics and Warehousing Market:
Vision 2030 and Infrastructure Investment: The Saudi government’s National Industrial Development and Logistics Program (NIDLP) aims to transform the Kingdom into a global logistics hub. Between 2018 and 2023, more than SAR 100 Billion was allocated to transport infrastructure development including dry ports, special economic zones, and bonded logistics zones.
E-Commerce Expansion: The rapid growth in e-commerce, with platforms such as Noon, Amazon.sa, and JollyChic, has significantly increased demand for last-mile delivery and urban warehousing. In 2023, e-commerce logistics accounted for 18% of total logistics revenues, up from 9% in 2019.
Diversification of Economy: As part of economic diversification efforts, the non-oil sectors, especially retail, pharmaceuticals, and industrial manufacturing, have witnessed robust growth. This has created demand for sector-specific warehousing solutions such as cold chain and hazardous goods storage.
Which Industry Challenges Have Impacted the Growth for Saudi Arabia Logistics and Warehousing Market
Fragmented Market and Lack of Standardization: The logistics and warehousing sector in Saudi Arabia remains highly fragmented, with a large number of small to mid-sized players operating with limited technological integration. According to industry estimates, over 60% of logistics providers in the Kingdom lack automated systems for inventory or fleet management. This results in inefficiencies, inconsistent service standards, and difficulties in meeting client expectations, particularly for multinational clients requiring integrated solutions.
Workforce Skill Gaps and Saudization Pressure: A shortage of skilled logistics professionals and the implementation of Saudization policies have posed operational challenges. In 2023, logistics companies reported a 25% turnover rate due to skill gaps and rising costs of hiring trained local staff. Many players are struggling to balance compliance with Saudization mandates while maintaining service efficiency.
Customs and Border Clearance Delays: Despite improvements, customs clearance and intermodal connectivity remain bottlenecks. In a 2023 industry report, 38% of logistics stakeholders cited border delays, document processing issues, and lack of coordination between customs departments as major hurdles. These issues lead to longer turnaround times and increased costs for freight operators.
What are the Regulations and Initiatives which have Governed the Market
Vision 2030 and NIDLP Reforms: As part of Vision 2030, the National Industrial Development and Logistics Program (NIDLP) aims to transform Saudi Arabia into a leading logistics hub by improving connectivity, enhancing regulatory transparency, and expanding logistics zones. Between 2020 and 2023, over SAR 30 Billion was allocated toward upgrading multimodal infrastructure including dry ports and bonded logistics zones.
Zakat, Tax, and Customs Authority (ZATCA) Digitalization: The implementation of digital customs platforms by ZATCA has streamlined import/export documentation. In 2023, over 85% of customs declarations were filed electronically, reducing average clearance time at major ports by 18%. These changes have encouraged global logistics firms to increase operations within the Kingdom.
Incentives in Special Economic Zones (SEZs): The government has launched SEZs such as the King Salman International Complex for Maritime Industries and Services and logistics zones in NEOM and Jazan. These zones offer tax holidays, reduced land lease costs, and simplified licensing procedures. In 2023, SEZs accounted for approximately 12% of the total warehousing stock in Saudi Arabia, a figure expected to rise rapidly by 2026.
Saudi Arabia Logistics and Warehousing Market Segmentation
By Market Structure: The market is segmented into organized and unorganized players. Organized players, including multinational logistics providers and large domestic firms, dominate in high-value segments such as contract logistics, international freight forwarding, and integrated warehousing solutions. These companies benefit from advanced IT systems, regulatory compliance, and partnerships with large corporates. Unorganized players, often local transporters and small warehouse operators, serve regional clients with low-cost, flexible services. However, they often lack standard operating procedures and modern infrastructure, impacting scalability and service consistency.
By Mode of Transport: Road transport is the most widely used mode, accounting for a major share due to Saudi Arabia’s vast highway network and heavy reliance on domestic truck movement for goods. Sea freight plays a key role in international trade, with ports like Jeddah, Dammam, and King Abdullah Port handling a substantial portion of imports and exports. Air freight, while limited in volume, is crucial for high-value and time-sensitive goods such as electronics, medical supplies, and express shipments.

By Type of Warehousing: General warehousing remains the most dominant type, serving industries such as retail, FMCG, and construction. However, specialized warehousing—including temperature-controlled, bonded, and hazardous goods storage—is gaining traction due to rising demand from pharmaceutical, food processing, and chemical industries. In 2023, cold chain warehousing witnessed a 16% year-on-year growth due to increasing consumption of perishables and biologics.
Competitive Landscape in Saudi Arabia Logistics and Warehousing Market
The Saudi logistics and warehousing market is moderately consolidated, with a mix of established domestic firms and international players operating across freight forwarding, contract logistics, last-mile delivery, and specialized warehousing. The growing demand for integrated logistics services and digital transformation has attracted new entrants and intensified competition across segments.
Company Name | Founding Year | Original Headquarters |
Bahri (National Shipping Company of Saudi Arabia) | 1978 | Riyadh, Saudi Arabia |
Saudi Post Logistics (SPL) | 1926 (modernized 2006) | Riyadh, Saudi Arabia |
SAL (Saudi Arabian Logistics) | 2020 (spun off from Saudia Cargo) | Jeddah, Saudi Arabia |
Agility Logistics Saudi Arabia | 1979 (KSA: ~2005) | Kuwait City, Kuwait |
Almajdouie Logistics | 1965 | Dammam, Saudi Arabia |
NAQEL Express | 1993 | Riyadh, Saudi Arabia |
Zajil Express | 1999 | Riyadh, Saudi Arabia |
SMSA Express | 1994 | Riyadh, Saudi Arabia |
Aramex Saudi Arabia | 1982 (KSA: ~1990s) | Dubai, UAE |
Tamer Logistics (Tamer Group) | 1922 | Jeddah, Saudi Arabia |
Binzagr Logistics Services | 1881 | Jeddah, Saudi Arabia |
Gulf Agency Company (GAC) Saudi Arabia | 1956 (KSA: ~1970s) | Gothenburg, Sweden |
Kuehne + Nagel Saudi Arabia | 1890 (KSA: ~1990s) | Schindellegi, Switzerland |
DHL Supply Chain Saudi Arabia | 1969 (KSA: ~1976) | Bonn, Germany |
DB Schenker Saudi Arabia | 1872 (KSA: ~2000s) | Essen, Germany |
UPS Saudi Arabia (via local partner) | 1907 (KSA: ~1997) | Atlanta, USA |
FedEx Saudi Arabia (via SAB Express) | 1971 (KSA: ~1994) | Memphis, USA |
Maersk Saudi Arabia Logistics | 1904 (KSA: ~2000s) | Copenhagen, Denmark |
CEVA Logistics Saudi Arabia | 2006 (KSA: ~2010s) | Marseille, France |
Yusen Logistics Saudi Arabia | 1955 (KSA: ~2010s) | Tokyo, Japan |
Some of the recent competitor trends and key information about competitors include:
Bahri Logistics: One of the largest logistics firms in the Kingdom, Bahri reported a 12% increase in revenue from inland logistics services in 2023. Its strategic focus includes fleet expansion, digital freight solutions, and alignment with Vision 2030 logistics goals.
Almajdouie Logistics: With a robust portfolio in industrial logistics, Almajdouie continues to be a key player in project cargo and supply chain solutions. In 2023, the company expanded its warehousing capacity in Riyadh by 20% to cater to rising demand from the manufacturing sector.
Agility Logistics: A major regional player, Agility has invested in scalable warehousing solutions and customs clearance automation in Saudi Arabia. Its 2023 partnership with a leading e-commerce firm boosted last-mile delivery volumes by 18% year-over-year.
Aramex: Focused on express logistics and e-commerce deliveries, Aramex saw strong growth in urban fulfillment centers in Jeddah and Riyadh. It launched AI-enabled route optimization tools in 2023, leading to a 14% improvement in delivery efficiency.
Naqel Express: Known for serving SMEs and retail sectors, Naqel expanded its cold chain capabilities in 2023 by launching temperature-controlled hubs in Dammam and Medina. Its cross-border services with GCC countries also gained traction.
SAL Saudi Logistics Services: A subsidiary of Saudia Group, SAL specializes in air cargo and ground handling services. In 2023, it handled over 600,000 tons of cargo, supported by investments in automated terminals at key airports.
Ajex Logistics: A newer entrant, Ajex focuses on time-critical shipments, particularly for healthcare and government clients. In 2023, it expanded into Tier-2 cities with a 3PL model aimed at pharmaceutical supply chains.

What Lies Ahead for Saudi Arabia Logistics and Warehousing Market?
The Saudi Arabia logistics and warehousing market is projected to witness sustained growth through 2029, driven by continued diversification of the economy, infrastructure expansion under Vision 2030, and rising demand from e-commerce, manufacturing, and retail sectors. The sector is expected to register a healthy CAGR during the forecast period.
Expansion of E-Commerce and Last-Mile Logistics: Rapid growth in digital retail platforms such as Noon and Amazon.sa will continue to fuel demand for last-mile delivery services and micro-fulfillment centers. By 2029, last-mile logistics is expected to account for over 25% of total logistics demand, driven by urbanization and rising customer expectations for faster delivery.
Rise of Smart Warehousing: Warehousing facilities in Saudi Arabia are transitioning towards automation, robotics, and AI-driven inventory management. Major logistics parks in Riyadh and Jeddah are expected to adopt smart solutions for real-time tracking, predictive maintenance, and warehouse optimization, improving overall operational efficiency and reducing costs.
Strategic Role of Logistics Hubs and SEZs: The expansion of Special Economic Zones (SEZs), dry ports, and bonded logistics zones will solidify Saudi Arabia’s position as a key transshipment and regional logistics hub. Projects like NEOM’s Oxagon and the King Salman Park are expected to attract global logistics players seeking regional bases for integrated supply chain operations.
Cold Chain and Pharma Logistics Growth: With increasing pharmaceutical imports and rising food consumption, the cold chain logistics segment is projected to grow at over 10% CAGR through 2029. Demand will be driven by stricter SFDA regulations, expansion of healthcare infrastructure, and consumer preference for high-quality perishables.
Future Outlook and Projections for Saudi Arabia Logistics and Warehousing Market on the Basis of Revenues in USD Billion, 2024-2029

Saudi Arabia Logistics and Warehousing Market Segmentation
- By Market Structure:
o Organized Logistics Providers
o Unorganized Logistics Operators
o Freight Forwarders
o 3PL & 4PL Service Providers
o Contract Logistics Companies
o Domestic Transporters
o International Logistics Firms - By Mode of Transport:
o Road Freight
o Sea Freight
o Air Freight
o Rail Freight
o Multimodal Logistics - By Type of Warehousing:
o General Warehousing
o Cold Chain Warehousing
o Bonded Warehousing
o E-commerce Fulfillment Centers
o Industrial Warehouses
o Distribution Hubs
o Temperature-Controlled Storage - By End-User Industry:
o FMCG
o Retail & E-commerce
o Healthcare & Pharmaceuticals
o Industrial Manufacturing
o Construction & Heavy Equipment
o Automotive
o Agriculture & Food - By Region:
o Riyadh
o Jeddah
o Dammam
o Makkah
o Eastern Province
o Tabuk
o NEOM Zone
Players Mentioned in the Report:
Freight Forwarding Companies
- Almajdouie Logistics
- Bahri Logistics
- Binzagr Company
- Arabco Logistics
- BAFCO International Shipping & Logistics
- Sharaf Shipping Agency
- Abdul Latif Jameel Logistics
- Al Jabri Logistics
- Abdul Latif Jameel IPR
- AYA Shipping Company
- Freights Solutions
- Crown Logistics
- Bayan Logistics
- Bridge Logistics
- Pan Gulf Logistics
- Transfreight Saudi Arabia
- United Gulf Logistics
- Sinotrans KSA
Warehousing Companies
- Advanced Storage Logistics
- Crown Logistics
- Momentum Logistics
- Bayan Logistics
- ALDREES Petroleum & Transport Services
- SAL (Saudi Logistics Zone)
E‑Commerce Logistics Companies
- SMSA Express Transportation
- NAQEL Express
- J&T Express
- AJEX Logistics Services
- Linkers Express
- Starlinks Logistics
- Esnad Express
- Mrsool
Express Logistics Companies
- DHL Express
- FedEx Express
- UPS
- Aramex
- Saudi Post
- SMSA Express Transportation
- NAQEL Express
- Esnad Express
- J&T Express
Key Target Audience:
- Logistics and Freight Forwarding Companies
- Warehousing and Cold Chain Providers
- E-commerce and Retail Chains
- Industrial and Manufacturing Firms
- Regulatory Bodies (e.g., ZATCA, SFDA, Ministry of Transport)
- Real Estate Developers (Industrial Parks & Logistics Zones)
- Investment and Private Equity Firms
- Infrastructure and Supply Chain Consultants
Time Period:
- Historical Period: 2018–2023
- Base Year: 2024
- Forecast Period: 2024–2029
Explore Flexible Purchase Options or Have Limited Budget?
Pay only for relevant chapters • Customizable report sections
Table of Contents
Choose individual sections to purchase. Mix and match as you like.
4.1. Macroeconomic framework for Saudi Arabia Including GDP (2018-2024), GDP Growth (2018-2024), GDP Contribution by Sector
4.2. Logistics Sector Contribution to GDP and how the contribution has been changing in the historical assessment
4.3. Ease of Doing Business in Saudi Arabia
4.4. LPI Index of Saudi Arabia and Improvements in the last 10-15 Years
4.5. Custom Procedure and Custom Charges in Saudi Arabia Logistics market
5.1. Landscape of Investment Parks and Free Trade Zones in Saudi Arabia
5.2. Current Scenario for Logistics Infrastructure in Saudi Arabia
5.3. Road Infrastructure in Saudi Arabia including Road Network, Toll Charges and Toll Network, Major Goods Traded through Road, Major Flow Corridors for Road (Inbound and Outbound)
5.4. Air Infrastructure in Saudi Arabia including Total Volume Handled, FTK for Air Freight, Major Inbound and Outbound Flow Corridors, Major Goods traded through Air, Number of Commercial and passenger Airports, Air Freight Volume by Ports and other Parameters
5.5. Sea Infrastructure in Saudi Arabia including Total Volume Handled, FTK for Sea Freight, Major Inbound and Outbound Flow Corridors, Major Goods Traded through Sea, Number of Ports for Coastal and Ocean Freight, Number of Vessels, Sea Freight Volume by Ports and other Parameters
5.6. Rail Infrastructure in Saudi Arabia including Total Volume Handled, FTK for Rail Freight, Major Inbound and Outbound Flow Corridors, Major Goods Traded through Rail and others
6.1. Basis Revenues, 2018-2024P
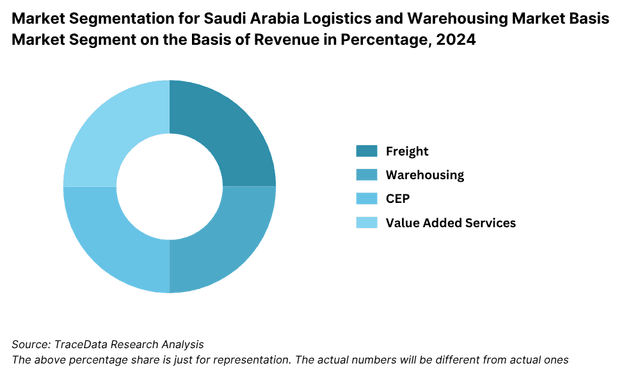
7.1. By Segment (Freight Forwarding, Warehousing, CEP and Value-Added Services), 2018-2024P
7.2. By End User Industries, 2018-2024P
8.1. Market Overview and Genesis
8.2. Saudi Arabia Freight Forwarding Market Size by Revenues, 2018-2024P
8.3. Saudi Arabia 3PL Freight Forwarding Market Segmentation, 2018-2024P
8.3.1. By Mode of Freight Transport (Road, Sea, Air and Rail), 2018-2024P
8.3.1.1. Price per FTK for Road/Air/Sea and Rail in Saudi Arabia
8.3.1.2. Road Freight (Domestic and International Volume, FTK and Revenue; Number of Registered Vehicles)
8.3.1.3. Road Freight Domestic and International Corridors
8.3.1.4. Ocean Freight (Domestic and International Volume, FTK and Revenue; Volume by Commodity; Sea Ports Key Statistics)
8.3.1.5. Air Freight (Domestic and International Volume, FTK and Revenue)
8.3.1.6. Rail Freight (Domestic and International Volume, FTK and Revenue; Volume by Commodity and Region)
8.3.1.7. Export-Import Scenario (Value by Mode of Transport, Commodity and Country; Volume by Principal Commodities)
8.3.2. By Intercity Road Freight Corridors, 2018-2024P
8.3.3. By International Road Freight Corridors, 2018-2024P
8.3.4. By End User (Industrial, FMCG, F&B, Retail and Others), 2018-2024P
8.4. Snapshot of Freight Truck Aggregators in Saudi Arabia Including Company Overview, USP. Business Strategies, Future Plans, Business Model, Number of Fleets, Margins/Commission, Number of Booking, Major Clients, Average Booking Amount, Major Routes and others
8.5. Competitive Landscape in Saudi Arabia Freight Forwarding Market, 2021
8.5.1. Heat Map of Major Players in Saudi Arabia Freight Forwarding on the Basis of Service offering
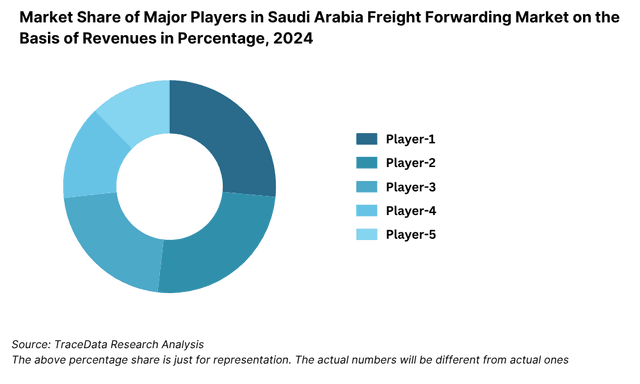
8.5.2. Market Share of Maior Players in Saudi Arabia Freight Forwarding Market, 2023
8.5.3. Cross Comparison of Major Players in Freight Forwarding Companies on the Basis of Parameters including Volume of Road Freight, Inception Year, Number of Fleets (Owned and Subcontracted), Fleets by Type, Occupancy Rate, Number of Employees, Major Route Network, Major Clients, Revenues, Volume of Sea Freight, Volume of Air Freight, USP, Business Strategy, Technology, (2023)
8.6. Saudi Arabia 3PL Freight Forwarding Future Market Size by Revenues, 2025-2029
8.7. Saudi Arabia Freight Forwarding Market Segmentation, 2025-2029
8.7.1. Future Market Segmentation by Mode of Freight Transport (Road, Sea, Air and Rail), 2025-2029
8.7.2. Future Market Segmentation by International Road Freight Corridors (China, Thailand and Saudi Arabia), 2025-2029
8.7.3. Future Market Segmentation by End User (Industrial, FMCG, F&B, Retail and Others), 2025-2029
9.1. Market Overview and Genesis
9.2. Value Chain Analysis in Saudi Arabia Warehousing Market including entities, margins, role of each entity, process flow, challenges and other aspects
9.3. Saudi Arabia Warehousing Market Size on the Basis of Revenues and Warehousing Space, 2018-2024P
9.4. Saudi Arabia 3PL Warehousing Segmentation
9.4.1. Saudi Arabia Warehousing Revenue by Business Model (Industrial/Retail, ICD/CFS and Cold Storage), 2018-2024P
9.4.2. Saudi Arabia Warehousing By Type of Warehouse (General, Open Yard, Freezer/Chiller, Ambient and Bonded Warehouses), 2018-2024P
9.4.3. Saudi Arabia Warehousing Revenue by End User (Industrial & Construction, FMCG, Retail, Food & Beverage and Others), 2018-2024P
9.4.4. 3PL Warehousing Space by Region, 2024P
9.5. Competitive Landscape in Saudi Arabia 3PL Warehousing Market
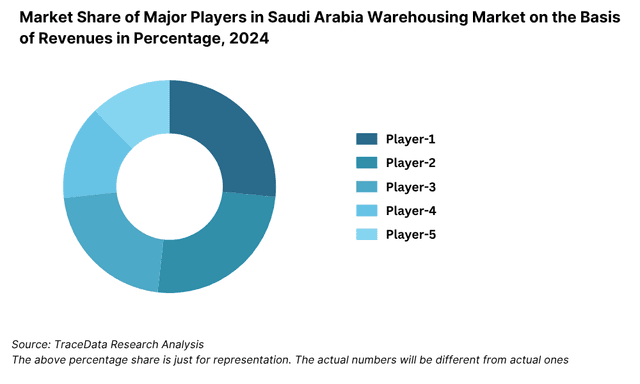
9.5.1. Market share of Top 10 Companies in Saudi Arabia Warehousing Market, 2023
9.5.2. Cross Comparison of Top 10 3PL Warehousing Companies on the Basis of Parameters including Company Overview, USP, Business Strategy, Future Plans, Technology, Revenues from Warehousing, Number of Warehouses, Warehousing Space, Location of Warehouses, Type of Warehouses, Occupancy Rate, Rental Rates, Clients and others, (2023)
9.6. Saudi Arabia Warehousing Future Market Size on the Basis of Revenues, 2025-2029
9.7. Saudi Arabia Warehousing Market Future Segmentation
9.7.1. Saudi Arabia Warehousing Revenue by Business Model (Industrial/Retail, ICD/CFS and Cold Storage), 2025-2029
9.7.2. Saudi Arabia Warehousing Revenue By Type of Warehouse (General, Open Yard, Freezer/Chiller, Ambient and Bonded Warehouses), 2025-2029
9.7.3. Saudi Arabia Warehousing Revenue by End User (Industrial & Construction, FMCG, Retail, Food & Beverage and Others), 2025-2029
10.1. Market Overview and Genesis
10.2. Value Chain Analysis in Saudi Arabia CEP Market including entities, margins, role of each entity, process flow, challenges and other aspects
10.3. Revenue Composition and Contribution Between First Mile/Mid Mile and Last Mile Delivery-Analysis for Domestic and International Shipments
10.4. Saudi Arabia CEP Market Size on the Basis of Revenues and Shipments, 2018-2024P
10.5. Saudi Arabia CEP Market Segmentation, 2021
10.5.1. Segmentation by Mails and Documents, E-Commerce Shipments and Express Cargo, 2023-2024P
10.5.2. Segmentation by International and Domestic Express, 2023-2024P
10.5.3. Segmentation by B2B, B2C and C2C, 2023-2024P
10.5.4. Segmentation by Period of Delivery, 2023-2024P
10.6. Competitive Landscape in 3PL Market, 2021
10.6.1. Overview and Genesis, Market Nature, Market Stage and Major Competing Parameters
10.6.2. Market Share of Companies in Saudi Arabia CEP Market on the Basis of Revenues/Number of Shipments, 2023
10.6.3. Market Share of Top 5 Companies in Saudi Arabia E-Commerce Shipment Market on the Basis of Revenues/Number of Shipments, 2023
10.6.4. Cross Comparison of Top 10 Saudi Arabia CEP Companies on the Basis of Parameters including Company Overview, USP, Business Strategy, Future Plans, Technology, Number of last Mile Delivery Shipments, Revenues, Major Clients, Number of Fleets, Number of Employees, Number of Riders, Number of Pin Code Served, Major Service Offering and others
10.7. Saudi Arabia CEP Market Size on the Basis of Revenues and Shipments, 2025-2029
10.8. Saudi Arabia CEP Market Segmentation
10.8.1. Segmentation by Mails and Documents, E-Commerce Shipments and Express Cargo, 2025-2029
10.8.2. Segmentation by International and Domestic Express, 2025-2029
10.8.3. Segmentation by B2B, B2C and C2C, 2025-2029
10.8.4. Segmentation by Period of Delivery, 2025-2029
11.1. Customer Cohort Analysis and End User Paradigm for Different Industry Verticals under Logistics Sector (Telecommunications, FMCG, Automotive, Apparel, F&B, Construction and Pharmaceuticals)
11.2. Understanding on Logistics Spend by End User, 2023-2024P
11.3. End User Preferences in terms of In-House or Outsourcing Logistics Services and Reason for Selection; Segregate this by Size of Company on the Basis of Revenues
11.4. Major Logistics Company who are Specialized in Serving Each Type of End User (Telecommunications, FMCG, Apparel, F&B, Construction and Pharmaceuticals)
11.5. Detailed Landscape of Each End Users across Parameters including Major Products Manufactured and Traded, Emerging Products, Type of Services Required, and Type of Services Outsourced, Major Companies, Contract Duration, Likelihood to Recommend, Market Orientation, Major Clusters, Type of Sourcing Preference, Pain Points, Facilities/Services Required, Future Outlook. Market Size for End User Industry Vertical with Growth Rate, 2018-2024P
12.1. Basis Revenues, 2025-2029
13.1. By Segment (Freight Forwarding, Warehousing, CEP and Value-Added Services), 2025-2029
13.2. By End User Industries, 2025-2029
13.3. Recommendation
13.4. Opportunity Analysis
Discuss a Customized Research Scope
Custom research scope • Tailored insights • Industry expertise
Research Methodology
Step 1: Ecosystem Creation
Map the ecosystem and identify all demand-side and supply-side entities operating in the Saudi Arabia Logistics and Warehousing Market. This includes 3PL providers, freight forwarders, warehouse developers, cold chain operators, e-commerce players, and end-user industries such as retail, manufacturing, and pharmaceuticals.
Based on this ecosystem mapping, we shortlist 5–6 leading logistics providers in the Kingdom using metrics such as fleet size, warehousing capacity, revenue contribution, geographic presence, and service diversification.
Initial sourcing is conducted via industry articles, government logistics strategy papers, logistics park masterplans, and proprietary/paid databases to establish a foundation of industry-level understanding.
Step 2: Desk Research
Engage in exhaustive desk research by referencing multiple credible sources including government publications (e.g., Vision 2030, NIDLP reports), logistics operator annual reports, port authority data, customs databases, and other proprietary data sources.
Analyze historical and current market performance across transport modes, warehouse types, end-user demand, service capabilities, and regional capacity distribution.
Compile company-specific data, including financials, operational infrastructure, service segments, client base, investment announcements, and strategic partnerships.
Step 3: Primary Research
Conduct in-depth interviews with senior leadership (CXOs, Logistics Directors, Supply Chain Heads) from logistics companies, warehousing developers, 3PL/4PL providers, and large-scale users across retail, FMCG, pharma, and e-commerce.
Objectives include validating hypotheses from secondary research, capturing real-time market sentiment, and gaining insights into pricing trends, utilization rates, operational challenges, and demand patterns.
Bottom-up estimation is performed through discussions around freight volumes handled, warehouse occupancy rates, and route/service capacity.
To enhance data reliability, our team also performs disguised interviews, approaching firms as potential clients. This method helps validate warehouse pricing, delivery lead times, cold chain service availability, and capacity bottlenecks from an end-user perspective.
Step 4: Sanity Check
A combination of bottom-to-top and top-to-bottom modeling approaches is applied to triangulate market size estimates.
Cross-validation is conducted using historical growth trends, infrastructure investment levels, and estimated industry expansion under Vision 2030.
Scenario-building exercises are used to project base, optimistic, and conservative forecasts through 2029.
See What's Inside the Report
Get a preview of key findings, methodology and report coverage
Frequently Asked Questions
The Saudi Arabia logistics and warehousing market is set for robust growth, projected to surpass SAR 110 Billion by 2029. This growth is driven by national transformation initiatives under Vision 2030, rising e-commerce penetration, diversification of the non-oil economy, and increasing demand for modern logistics infrastructure. Government-backed investments and international partnerships are expected to position the Kingdom as a regional logistics hub bridging Asia, Africa, and Europe.
The market features a combination of leading domestic and international players including Bahri Logistics, Almajdouie Logistics, Agility Logistics, Aramex, Naqel Express, and SAL Saudi Logistics Services. These firms are recognized for their extensive networks, integrated service offerings, and investments in warehousing, technology, and last-mile delivery capabilities.
Key growth drivers include large-scale infrastructure projects under the National Industrial Development and Logistics Program (NIDLP), the rapid expansion of e-commerce, privatization of logistics zones, and increased trade through strategic seaports and dry ports. Additionally, rising demand from sectors such as healthcare, retail, and FMCG continues to propel the need for warehousing and distribution services.
The sector faces several challenges such as market fragmentation, lack of skilled logistics professionals, and customs clearance inefficiencies. Compliance with Saudization policies, underdeveloped multimodal connectivity, and the need for digital transformation among smaller players also hinder operational efficiency and scalability in the market.
License Options
PDF + Excel
Complete report package
$4,000
Excel Only
Data and analytics
$2,500
Custom Sections
Starts from $100
$0