Saudi Arabia Smart Home Devices Market Outlook to 2029
By Device Category, By Connectivity Protocol, By Dwelling Type, By Sales Channel, By Price Band, and By Region
Report Overview
Report Code
TDR0322
Coverage
Middle East
Published
September 2025
Pages
80
On This Page
Report Overview
The report titled “Saudi Arabia Smart Home Devices Market Outlook to 2029 - By Device Category, By Connectivity Protocol, By Dwelling Type, By Sales Channel, By Price Band, and By Region” provides a comprehensive analysis of the smart home devices market in Saudi Arabia. The report covers an overview and genesis of the industry, overall market size in terms of revenue, market segmentation; trends and developments, regulatory landscape, customer level profiling, issues and challenges, and competitive landscape including competition scenario, cross-comparison, opportunities and bottlenecks, and company profiling of major players in the smart home devices market.
Report Coverage
Verified Market Sizing
Multi-layer forecasting with historical data and 5–10 year outlook
Deep-Dive Segmentation
Cross-sectional analysis by product type, end user, application and region
Competitive Benchmarking & Positioning
Market share, operating model, pricing and competition matrices
Actionable Insights & Risk Assessment
High-growth white spaces, underserved segments, technology disruptions and demand inflection points
Review Methodology & Data Structure
Preview report structure, data sources and research framework
Executive Summary
The report titled “Saudi Arabia Smart Home Devices Market Outlook to 2029 - By Device Category, By Connectivity Protocol, By Dwelling Type, By Sales Channel, By Price Band, and By Region” provides a comprehensive analysis of the smart home devices market in Saudi Arabia. The report covers an overview and genesis of the industry, overall market size in terms of revenue, market segmentation; trends and developments, regulatory landscape, customer level profiling, issues and challenges, and competitive landscape including competition scenario, cross-comparison, opportunities and bottlenecks, and company profiling of major players in the smart home devices market. The report concludes with future market projections based on device volumes, product categories, regions, cause-and-effect relationships, and success case studies highlighting the major opportunities and cautions.
Saudi Arabia Smart Home Devices Market Overview and Size
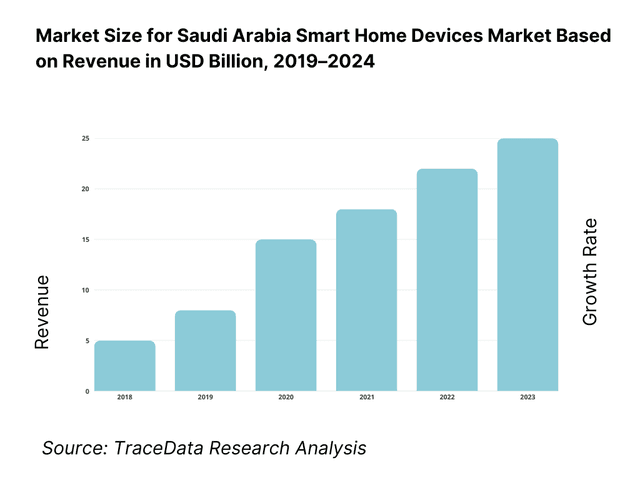
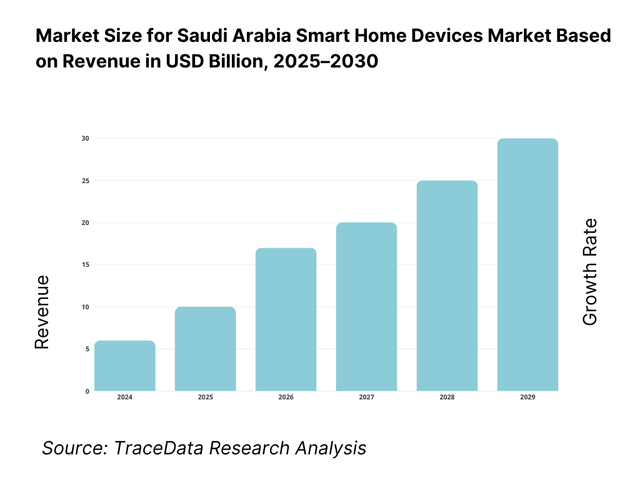
The Saudi Arabia smart home devices market is valued at USD 416.3 million, based on a five-year historical analysis. Adoption is being pulled by ubiquitous connectivity (CST reports 99% internet penetration and G20-leading mobile speeds) and rising digital spending (CST pegs the broader ICT market at SAR 180 billion ≈ USD 48 billion). These scale economics in connected infrastructure through 2024 underpin higher attach rates for security cameras, smart locks, displays, lighting and HVAC sensors.
Riyadh, Jeddah and the Eastern Province (Dammam–Khobar–Dhahran) dominate due to density of affluent, villa-heavy neighborhoods, greenfield housing stock and digital enablement. Saudi Arabia’s population reached 35.3 million in 2024 (from 33.7 million in 2023), with Riyadh as the largest urban economy and a focal point of Vision 2030 investment; CST also highlights top-tier access speeds and usage patterns that favor always-connected homes. These cities concentrate premium retail (Jarir, eXtra) and systems integrators that bundle security and energy solutions into new developments.
What Factors are Leading to the Growth of the Saudi Arabia Smart Home Devices Market:
Ubiquitous connectivity and digitally active households: Saudi households are among the world’s most connected, providing a ready substrate for device adoption. The national regulator confirmed 99% internet usage across the Kingdom, with home being the primary access point and peak use concentrated in evening hours—patterns that favor always-on cameras, speakers, and hubs. The Kingdom’s population reached 35.3 million people, adding 1.6 million in the latest annual cycle, which expands the base of digitally active homes in major metros. Riyadh holds the largest household concentration, supported by very high urbanization (World Bank series shows an urban share above 8 in 10 residents).
Rising consumption capacity supporting durable tech purchases: Macroeconomic demand fundamentals remain supportive for connected-home categories that ride on discretionary spend. The World Bank reports households’ and NPISHs’ final consumption expenditure in Saudi Arabia in current US$ (latest post-pandemic readings are elevated versus 2022), while overall final consumption expenditure for the economy adds further ballast to retail device turnover. Within the Kingdom’s household structure, Riyadh alone accounts for over a quarter of households, concentrating electronics retail and services. These aggregates—consumption in US$ and regional household concentration—translate into larger store networks and higher attach rates for multi-device bundles in security, lighting, and climate control.
Cooling-intensive residential load and electrification of living spaces: Device categories that optimize electricity use (smart thermostats/AC controllers, sensors, smart plugs) benefit from Saudi Arabia’s high residential electricity demand. GASTAT’s Household Energy Statistics 2023 show residential electricity consumption of 152,782 GWh, underscoring a large, addressable base for energy-saving controls and usage-aware automation. On the supply side, the national grid continues to scale with rising peaks; government communications reported peak load at 75.1 GW in mid-year readings—highlighting the system-wide importance of demand-side efficiency. These magnitudes justify utility-aligned and consumer-driven investments in smart control devices across villas and apartments.
Which Industry Challenges Have Impacted the Growth of the Saudi Arabia Smart Home Devices Market:
Interoperability and retrofit complexity in a mixed housing stock: High connectivity does not eliminate installation friction. Riyadh alone concentrates over a quarter of national households, but apartments and older stock often lack neutral wiring or structured cabling, complicating deployment of smart switches and hubs. Urbanization above 8 in 10 residents compresses installation windows in dense districts, increasing reliance on wireless protocols that must coexist with crowded Wi-Fi bands. This real-estate reality raises truck-rolls and return rates when devices fail to pair seamlessly across brands or apartments. Macro signals—household concentration in core metros and sustained urban density—translate into persistent retrofit complexity.
Energy intensity and seasonal peak stress shaping device expectations: With residential consumption at 152,782 GWh and nationally communicated peaks around 75.1 GW, consumers expect tangible electricity savings and reliable operation in high heat. Devices that fail to automate cooling efficiently or that add phantom loads face pushback. Macro energy intensity also pressures retailers and integrators to prove payback through control strategies tied to local usage patterns. The magnitude of household electricity use makes reliability (firmware updates, thermal tolerance) a gating factor for brand choice in the Kingdom’s summer peaks.
Data privacy and cybersecurity compliance workload for connected homes: Saudi Arabia’s Personal Data Protection Law (PDPL) and updated Essential Cybersecurity Controls (ECC-2:2024) formalize strict obligations. The ECC document enumerates 108 main controls and 92 sub-controls across 28 subdomains that impact cloud-connected devices and platforms. The PDPL implementing regulation introduces prescribed breach-notification timetables (e.g., reporting within 72 hours), driving operational overhead for vendors handling video and voice data. These quantified compliance elements raise integration costs and certification timelines for device brands, especially those localizing cloud services or analytics within the Kingdom.
What are the Regulations and Initiatives which have Governed the Market:
Personal Data Protection Law (PDPL) and Implementing Regulations: Saudi Arabia’s PDPL—administered by SDAIA—sets controller/processor obligations for personal data handled by smart devices (cameras, voice assistants, occupancy sensors). The Implementing Regulation prescribes timelines such as reporting a personal-data breach within 72 hours, specifies disclosures, and defines conditions for cross-border transfers. For consumer IoT, this means cloud storage of video/voice and analytics must align to explicit controller duties, records of processing, and lawful basis requirements—each a formal step in onboarding devices to the KSA market.
National Cybersecurity Authority – Essential Cybersecurity Controls: The NCA’s updated ECC-2:2024 defines the minimum baseline for entities providing digital services in the Kingdom. The standard catalogs 4 main domains, 28 subdomains, 108 main controls and 92 sub-controls, with applicability to cloud backends, mobile apps, and gateways used by smart-home ecosystems. Vendors integrating with local telcos or selling into developer projects must evidence alignment with these quantified controls—spanning identity, asset hardening, operations, and incident response—prior to scaled deployments.
CST – Internet of Things (IoT) Regulations & Guidance: The Communications, Space and Technology Commission documents the scope of IoT technology, devices, connectivity, and service providers, with obligations covering numbering, connectivity, device approvals, and service licensing. The guidance consolidates the list of applicable regulations impacting IoT solutions in the Kingdom and directs providers to verify updates before deployment. Smart-home OEMs and distributors must ensure devices and gateways comply with the enumerated regulatory set when offered through retail, telco bundles, or developer channels.
Saudi Arabia Smart Home Devices Market Segmentation
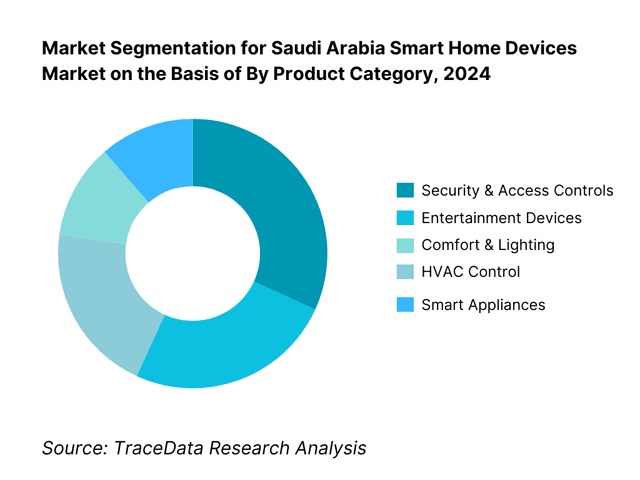
By Product Category: The Saudi Arabia smart home devices market is segmented into the above categories. Security & access controls currently holds a dominant market share in 2024. This is driven by high willingness to pay for property protection in villa communities, rapid uptake of connected cameras/video doorbells, and insurance-friendly features like event recording and remote monitoring. Retailers (Jarir, eXtra) heavily merchandise doorbell cameras and smart locks, while integrators bundle multi-camera NVR kits into new housing, reinforcing category leadership over entertainment and lighting.
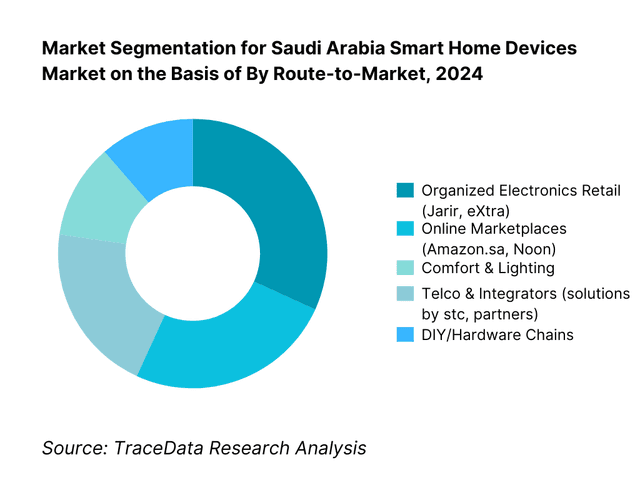
By Route-to-Market: The market is segmented into offline organized retail, online marketplaces, telco/integrator channels, DIY/hardware, and developer bundles. Organized electronics retail is dominant in 2024 because it combines availability of global brands with Arabic UX support, in-store demos and installation services, reducing buyer friction for first-time users. Jarir and eXtra anchor nationwide shelf presence, financing offers, and attach-rate services (warranty/install), outpacing purely online carts and ensuring trust in categories like locks and cameras where fit-and-finish and hands-on advice matter.
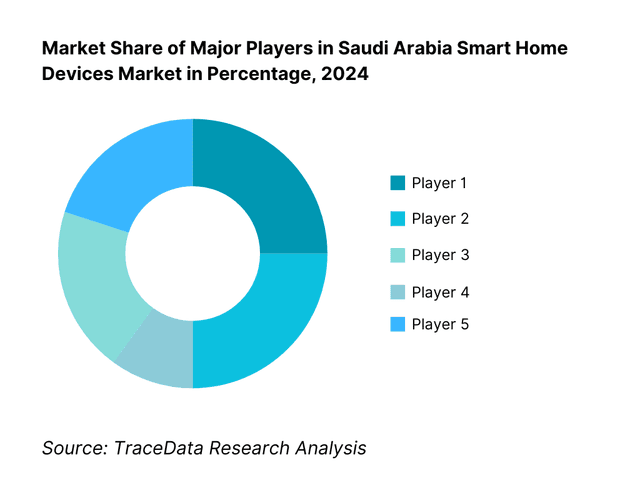
Competitive Landscape in Saudi Arabia Smart Home Devices Market
The Saudi Arabia smart home devices market shows a concentrated “front-of-store” dynamic around organized retail and telco-integrator ecosystems, coupled with global device OEMs. Retail leaders (Jarir, eXtra) curate assortments and offer installation, while solutions by stc and enterprise OEMs (Honeywell, Schneider) influence higher-value security/energy projects. This multi-tier model, backed by robust connectivity and Vision 2030 urban developments, sustains premium ASPs and cross-category bundles.
Name | Founding Year | Original Headquarters |
Amazon (Ring, Alexa) | 1994 | Seattle, USA |
Google (Nest) | 1998 | Mountain View, USA |
Apple | 1976 | Cupertino, USA |
Samsung Electronics | 1969 | Suwon, South Korea |
LG Electronics | 1958 | Seoul, South Korea |
Xiaomi | 2010 | Beijing, China |
Huawei | 1987 | Shenzhen, China |
TP-Link (Tapo/Kasa) | 1996 | Shenzhen, China |
Signify (Philips Hue) | 2016 | Eindhoven, Netherlands |
Aqara (Lumi United) | 2009 | Shenzhen, China |
eufy (Anker Innovations) | 2011 | Shenzhen, China |
Schneider Electric (Wiser) | 1836 | Rueil-Malmaison, France |
Legrand (Netatmo) | 1904 | Limoges, France |
Honeywell | 1906 | Charlotte, USA |
Arlo Technologies | 2014 | San Jose, USA |
Some of the Recent Competitor Trends and Key Information About Competitors Include:
Amazon (Ring, Alexa): Amazon has expanded its smart security portfolio in Saudi Arabia by introducing Ring Video Doorbell and Ring Stick Up Cam bundles through Jarir and eXtra in 2024. The company also enhanced Arabic language integration for Alexa devices, making them more accessible to Saudi households and strengthening its foothold in the premium home security segment.
Samsung Electronics (SmartThings): Samsung has leveraged its strong position in appliances and televisions to integrate SmartThings hubs into new product lines in 2024. The brand focused on bundling energy-efficient appliances with smart controllers, aligning with Saudi Arabia’s Vision 2030 sustainability goals and SASO energy efficiency regulations.
Xiaomi: Xiaomi continued to dominate the affordable smart home category by expanding its Mi Home ecosystem in 2024 across Amazon.sa and Noon. The company introduced competitively priced cameras, robot vacuums, and smart lighting products, appealing to middle-income households and expatriates seeking value-driven solutions.
Honeywell: Honeywell has strengthened its presence in enterprise-grade smart home and building technologies by working with solutions by stc and real-estate developers in 2024. The company emphasized smart thermostats and IAQ sensors, directly addressing Saudi Arabia’s high energy consumption in cooling systems.
Schneider Electric (Wiser): Schneider Electric launched updated Wiser home automation solutions in Saudi Arabia in 2024, with features tailored for Arabic mobile interfaces and villa installations. The company has also partnered with giga-projects such as NEOM and ROSHN, embedding automation and energy management into large-scale residential communities.
What Lies Ahead for Saudi Arabia Smart Home Devices Market?
The Saudi Arabia smart home devices market is expected to continue its upward trajectory by 2030, supported by rising urban household formation, widespread broadband and 5G adoption, and the government’s Vision 2030 push for smart cities and sustainable living. Expansion of giga-projects such as NEOM and ROSHN will embed smart devices into housing at scale, while households in Riyadh, Jeddah, and the Eastern Province are expected to remain early adopters of connected security, lighting, and energy solutions.
Rise of Integrated Ecosystem Living: The future of smart homes in Saudi Arabia will emphasize seamless integration across security, lighting, HVAC, and appliances. With telcos and developers acting as ecosystem orchestrators, bundled solutions will dominate over single-device purchases, ensuring unified app control and reduced interoperability issues.
Energy Efficiency and Sustainability Push: Driven by high residential electricity consumption (over 152,000 GWh annually), the market will increasingly prioritize devices that optimize air conditioning and lighting loads. Smart thermostats, plugs, and energy dashboards will become essential tools for households and developers aiming to align with SASO and SEEC efficiency mandates.
Localization of User Experience: As adoption broadens, demand for Arabic voice support, right-to-left interfaces, and region-specific routines will rise. Devices that cater to Arabic UX and align with cultural norms, such as prayer-time lighting scenes or family-oriented security settings, will gain a competitive edge.
Growth of Developer and ISP Bundles: With new housing units planned under Vision 2030, smart devices will increasingly be pre-installed at handover. ISPs like stc and Mobily are expected to expand “smart-home consultation services,” bundling connectivity, devices, and support into monthly plans, lowering barriers to adoption for mass households.
AI-Driven Home Intelligence: AI and analytics will be harnessed to predict energy peaks, optimize AC cycles, and enhance security with real-time anomaly detection. Edge AI in cameras, speakers, and sensors will allow localized decision-making, improving responsiveness and addressing data privacy mandates under Saudi Arabia’s Personal Data Protection Law (PDPL).
Saudi Arabia Smart Home Devices Market Segmentation
By Device Category
Security & Access Controls
Comfort & Lighting
Climate & Energy Management
Entertainment & Media
Appliances & Cleaning
Hubs & Controllers
By Connectivity/Protocol
Wi-Fi
Zigbee
Z-Wave
Thread/Matter
Bluetooth Low Energy (BLE)
By Dwelling Type
Villas
Apartments
Compounds & Gated Communities
Mixed-use Residences
Staff Housing
By Sales Channel
Organized Electronics Retail (Jarir, eXtra, Lulu)
Online Marketplaces (Amazon.sa, Noon)
Telecom/ISP Bundles (stc, Zain, Mobily)
System Integrators (B2B and luxury home installers)
Developer Pre-installs (NEOM, ROSHN, Diriyah projects)
By Region
Riyadh
Makkah & Jeddah
Eastern Province (Dammam, Dhahran, Khobar)
Madinah
Asir & Others
Players Mentioned in the Report:
solutions by stc (stc Group)
Jarir Marketing Co. (Jarir Bookstore)
United Electronics Co. (eXtra)
Honeywell Saudi Arabia
Schneider Electric Saudi Arabia
Samsung Electronics
LG Electronics
Xiaomi
Amazon
Google
Apple
Arlo
Ezviz
Philips Hue / Signify
Bosch Smart Home
Key Target Audience
Telcos and Digital Service Providers (stc Group, Zain, Mobily)
Residential Developers & Master Planners (NEOM, ROSHN, Diriyah Company)
Building Technology OEMs & Home Appliance Manufacturers
Systems Integrators & Low-Voltage Contractors
Organized Electronics Retailers & Marketplaces (Jarir, eXtra, Amazon.sa, Noon)
Property Managers & Facilities Management Firms
Investments and Venture Capitalist Firms (PIF, Sanabil, STV, Wa’ed Ventures)
Government & Regulatory Bodies (CST, MOMRAH, Ministry of Energy, GASTAT, SASO)
Time Period:
Historical Period: 2019-2024
Base Year: 2025
Forecast Period: 2025-2030
See What's Inside the Report
Get a preview of key findings, methodology and report coverage
Table of Contents
1. Executive Summary
2. Research Methodology
3. Ecosystem of Key Stakeholders in KSA Smart Home Devices Market [ISPs (stc, Mobily, Zain); real-estate developers (NEOM, ROSHN); device OEMs (Amazon, Google, Xiaomi, Philips Hue, etc.); distributors; retailers (Jarir, eXtra, Lulu, Amazon.sa, Noon); system integrators; regulators (SDAIA, NCA, CST, SASO, SEEC)]
4. Value Chain Analysis
4.1 Delivery Model Analysis for Smart Home Devices-Direct Retail, ISP Bundled, Developer Pre-installs, System Integrator Installations (Margins, Preferences, Strengths and Weaknesses)
4.2 Revenue Streams for KSA Smart Home Devices Market [Hardware sales, subscriptions (cloud storage/security monitoring), installation services, extended warranties, bundled ISP plans]
4.3 Business Model Canvas for KSA Smart Home Devices Market [Key partners, activities, value propositions, revenue models, customer segments, cost structure]
5. Market Structure
5.1 ISP-Bundled Devices vs. Retail-Led Adoption
5.2 Investment Model in KSA Smart Home Devices Market [Developer pre-install financing, ISP subsidy/bundles, consumer BNPL financing in retail]
5.3 Comparative Analysis of Funnel Process by Private ISPs and Government-Backed Developers [Awareness → Trial → Adoption → Expansion]
5.4 Household Smart Home Budget Allocation by Income Group [High-income villas vs. apartments; expatriate vs. Saudi nationals]
6. Market Attractiveness for KSA Smart Home Devices Market [Category heatmap: security, lighting, climate control, appliances, hubs; install friction score; attach-rate opportunities]
7. Supply-Demand Gap Analysis [Installer capacity vs. demand; Arabic UX support gaps; Matter-ready device availability; developer pipeline vs. device supply]
8. Market Size for KSA Smart Home Devices Market Basis
8.1 Revenues (Historical & Present)
9. Market Breakdown for KSA Smart Home Devices Market Basis
9.1 By Market Structure (ISP Bundled, Retail, E-commerce, Developer Pre-Installs, Integrator-Led)
9.2 By Device Type (Security & Access, Climate & Energy, Lighting, Appliances, Hubs/Controllers)
9.3 By Consumer Segment (Saudi Nationals, Expatriates, High-Income Early Adopters, Family Households, Renters)
9.4 By Dwelling Type (Villas, Apartments, Compounds/Gated Communities, Mixed-Use Residences, Staff Housing)
9.5 By Sales Channel (Telecom/ISP Bundles, Modern Retail, Pure-play E-commerce, System Integrators, Developer Installs)
9.6 By Connectivity Protocol (Wi-Fi, Zigbee, Z-Wave, Thread/Matter, Bluetooth LE)
9.7 By Price Band (Entry, Mid, Premium, Professional/Integrator, Luxury Designer Lighting)
9.8 By Region (Riyadh, Makkah/Jeddah, Eastern Province, Madinah, Asir & Others)
10. Demand Side Analysis for KSA Smart Home Devices Market
10.1 Household Digital Readiness and Cohort Analysis [Broadband penetration, fiber/5G availability, device attach-rate]
10.2 Smart Home Needs and Decision-Making Process [Security vs. convenience vs. energy savings vs. prestige]
10.3 ROI & Effectiveness of Smart Devices [Energy savings payback (AC loads), security ROI, resale property value]
10.4 Gap Analysis Framework [UX gaps, protocol mismatch, installer availability]
11. Industry Analysis
11.1 Trends and Developments for KSA Smart Home Devices Market [Matter adoption, ISP consultation services, premium lighting integration]
11.2 Growth Drivers for KSA Smart Home Devices Market [Smart city/giga projects, high AC penetration, ISP bundling]
11.3 SWOT Analysis for KSA Smart Home Devices Market
11.4 Issues and Challenges for KSA Smart Home Devices Market [PDPL compliance, climatic durability, installation skills]
11.5 Government Regulations for KSA Smart Home Devices Market [PDPL, NCA cybersecurity, CST IoT rules, SASO/SEEC energy standards]
12. Snapshot on Online Smart Home Devices Market (E-commerce & ISP Bundles)
12.1 Market Size and Future Potential for Online Smart Home Device Sales in KSA
12.2 Business Models and Revenue Streams [One-time sales, subscriptions, bundled ISP plans]
12.3 Delivery Models and Type of Devices Offered [DIY kits, professional installations, BNPL financing]
13. Opportunity Matrix for KSA Smart Home Devices Market-Presented with the Help of Radar Chart
14. PEAK Matrix Analysis for KSA Smart Home Devices Market
15. Competitor Analysis for KSA Smart Home Devices Market
15.1 Market Share of Key Players in KSA Smart Home Devices Market (Basis Revenues)
15.2 Benchmark of 15 Key Competitors in KSA Smart Home Devices Market Including Variables such as Company Overview, USP, Business Strategies, Business Model, Product Portfolio, Revenues, Pricing, Technology Used, Warranty/After-Sales Network, Strategic Tie-Ups, Marketing Strategy, Recent Developments
15.3 Operating Model Analysis Framework
15.4 Gartner Magic Quadrant (Smart Home Ecosystems in KSA)
15.5 Bowman’s Strategic Clock for Competitive Advantage
16. Future Market Size for KSA Smart Home Devices Market Basis
16.1 Revenues (Forecast)
17. Market Breakdown for KSA Smart Home Devices Market Basis
17.1 By Market Structure (ISP Bundled, Retail, E-commerce, Developer, Integrator)
17.2 By Device Type (Security, Climate, Lighting, Appliances, Hubs/Controllers)
17.3 By Consumer Segment (Saudi Nationals, Expatriates, High-Income Early Adopters, Family Households, Renters)
17.4 By Dwelling Type (Villas, Apartments, Compounds, Mixed-Use Residences, Staff Housing)
17.5 By Sales Channel (ISP Bundles, Retail, E-commerce, System Integrators, Developers)
17.6 By Connectivity Protocol (Wi-Fi, Zigbee, Z-Wave, Thread/Matter, Bluetooth LE)
17.7 By Price Band (Entry, Mid, Premium, Pro, Luxury)
17.8 By Region (Riyadh, Makkah/Jeddah, Eastern Province, Madinah, Asir & Others)
18. Recommendations
19. Opportunity Analysis
Discuss a Customized Research Scope
Custom research scope • Tailored insights • Industry expertise
Research Methodology
Step 1: Ecosystem Creation
Map the ecosystem and identify all the demand-side and supply-side entities for the Saudi Arabia Smart Home Devices Market. On the demand side, households in Riyadh, Jeddah, and the Eastern Province form the largest adoption base, while residential developers such as NEOM and ROSHN are embedding devices into giga-project housing. On the supply side, key entities include global OEMs (Amazon, Samsung, Xiaomi, Honeywell, Schneider), telecom operators (stc, Zain, Mobily), organized retailers (Jarir, eXtra), and e-commerce platforms (Amazon.sa, Noon). Based on this ecosystem, we will shortlist leading 5–6 device providers and distributors in the country using financial information, market reach, and partnerships with developers and telcos. Sourcing is conducted through government portals (CST, GASTAT, SASO, SEEC), industry articles, multiple secondary, and proprietary databases to perform desk research around the market to collate industry-level information.
Step 2: Desk Research
Subsequently, we engage in an exhaustive desk research process by referencing diverse secondary and proprietary databases. This approach enables us to conduct a thorough analysis of the market, aggregating industry-level insights. We delve into aspects such as household electricity consumption (152,782 GWh in 2023, GASTAT), population growth (35.3 million in 2024, GASTAT), internet penetration (99% usage, CST) and device adoption trends across different regions. We supplement this with detailed examinations of company-level data, relying on sources such as press releases, annual reports, and local distributor announcements. This process aims to construct a foundational understanding of both the market and the entities operating within it.
Step 3: Primary Research
We initiate a series of in-depth interviews with C-level executives and other stakeholders representing various Saudi Arabia Smart Home Devices Market companies and end-users. This interview process serves a multi-faceted purpose: to validate market hypotheses, authenticate statistical data, and extract valuable operational and financial insights from these industry representatives. A bottom-to-top approach is undertaken to evaluate revenue contributions for each player, thereby aggregating to the overall market. As part of our validation strategy, our team executes disguised interviews wherein we approach each company under the guise of potential clients. This approach enables us to validate the operational and financial information shared by company executives, corroborating this data against what is available in secondary databases. These interactions also provide us with a comprehensive understanding of revenue streams, value chains, processes, pricing, and other factors.
Step 4: Sanity Check
A bottom-to-top and top-to-bottom analysis along with market size modeling exercises is undertaken to assess the sanity of the process. This includes reconciling device shipment volumes from distributors with macro indicators such as household formation, residential electricity consumption, and broadband penetration, ensuring both numerical and strategic consistency in the final output.
See What's Inside the Report
Get a preview of key findings, methodology and report coverage
Frequently Asked Questions
The Saudi Arabia Smart Home Devices Market is poised for substantial expansion, valued at USD 416.3 million in 2023. This potential is driven by nationwide digital readiness, with 99% internet penetration and a population of 35.3 million supporting demand for connected devices. The market’s growth is further reinforced by Vision 2030 programs such as NEOM and ROSHN, which are embedding smart technologies into new housing communities, establishing a robust ecosystem for adoption across villas and apartments.
The Saudi Arabia Smart Home Devices Market features several key players, including Amazon (Ring, Alexa), Samsung (SmartThings), and Xiaomi (Mi Home). These companies dominate the market due to their broad product portfolios, affordability options, and partnerships with major retailers like Jarir and eXtra. Other notable players include Honeywell and Schneider Electric, which are deeply integrated into developer projects and telco partnerships, while Google Nest, Apple HomeKit, and Philips Hue (Signify) strengthen the global presence with security, automation, and lighting solutions tailored for Saudi households.
Key growth drivers include high household connectivity—with 99% internet usage reported by CST—and robust urbanization, with over 80% of Saudi Arabia’s population living in cities. Energy intensity is another factor: households consumed 152,782 GWh of electricity in 2024, boosting demand for energy-saving smart thermostats and AC controllers. Additionally, giga-projects like NEOM and Diriyah are embedding IoT infrastructure in real estate developments, creating large-scale opportunities for device integration across security, lighting, and energy management systems.
Challenges stem from retrofit complexity in older housing stock, where wiring limitations hinder seamless installation of devices. Seasonal energy peaks of 75.1 GW pressure devices to deliver tangible energy savings, raising consumer expectations for reliability. Data privacy compliance under the Personal Data Protection Law (PDPL) also poses hurdles, requiring breach reporting within 72 hours and stricter cross-border transfer controls. In addition, market fragmentation across multiple ecosystems (Wi-Fi, Zigbee, Thread, Matter) adds interoperability challenges, complicating device integration for mass households.
License Options
PDF + Excel
Complete report package
$4,000
Excel Only
Data and analytics
$2,500