South Africa Thermoform Packaging Market Outlook to 2030
By Product Type, By Material, By End-Use Industry, By Forming Process, By Sealing/Closure Format, and By Region
Report Overview
Report Code
TDR0354
Coverage
Africa
Published
October 2025
Pages
80
Flexible Purchase Options
Select and purchase only the chapters you need for your strategic decisions
On This Page
Report Overview
The report titled “South Africa Thermoform Packaging Market Outlook to 2030 - By Product Type, By Material, By End-Use Industry, By Forming Process, By Sealing/Closure Format, and By Region” provides a comprehensive analysis of the thermoform packaging market in South Africa. The report covers an overview and genesis of the industry, overall market size in terms of revenue, market segmentation; trends and developments, regulatory landscape, customer level profiling, issues and challenges, and competitive landscape including competition scenario, cross-comparison, opportunities and bottlenecks, and company profiling of major players in the thermoform packaging market.
Report Coverage
Verified Market Sizing
Multi-layer forecasting with historical data and 5–10 year outlook
Deep-Dive Segmentation
Cross-sectional analysis by product type, end user, application and region
Competitive Benchmarking & Positioning
Market share, operating model, pricing and competition matrices
Actionable Insights & Risk Assessment
High-growth white spaces, underserved segments, technology disruptions and demand inflection points
Review Methodology & Data Structure
Preview report structure, data sources and research framework
Executive Summary
The report titled “South Africa Thermoform Packaging Market Outlook to 2030 - By Product Type, By Material, By End-Use Industry, By Forming Process, By Sealing/Closure Format, and By Region” provides a comprehensive analysis of the thermoform packaging market in South Africa. The report covers an overview and genesis of the industry, overall market size in terms of revenue, market segmentation; trends and developments, regulatory landscape, customer level profiling, issues and challenges, and competitive landscape including competition scenario, cross-comparison, opportunities and bottlenecks, and company profiling of major players in the thermoform packaging market. The report concludes with future market projections based on pack volumes, material flows, regions, cause-and-effect relationships, and success case studies highlighting the major opportunities and cautions.
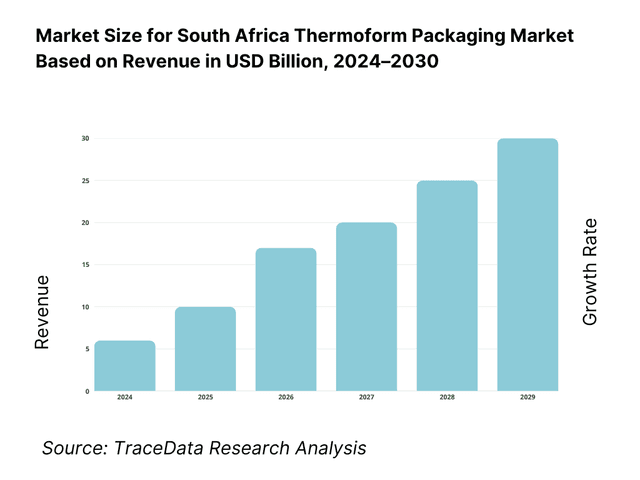
South Africa Thermoform Packaging Market Overview and Size
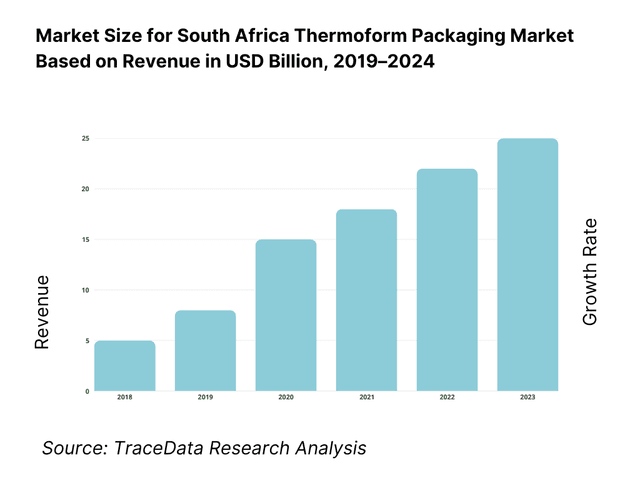
Thermoform packaging in South Africa sits within a plastic-packaging industry valued at USD 2,350.0 million and anchored by high-volume food, beverage, and pharma uses. A core thermoform subcategory—blister packaging—accounted for USD 190.1 million in sales, underscoring healthcare and FMCG pull. In the subsequent cycle, brand-owner signatories to the SA Plastics Pact placed 209,300 tonnes of plastic packaging on the market, signaling sustained volume needs for punnets, trays, clamshells and blisters used across fresh produce, ready meals and personal care.
Gauteng (Johannesburg–Ekurhuleni) dominates due to its ~33–35% share of national GDP and ~45% of manufacturing capacity; it concentrates converters, retailers and distribution hubs. KwaZulu-Natal (Durban/eThekwini) is pivotal as Durban port handles ~60% of South Africa’s containers, enabling inbound resin and outbound finished packs. The Western Cape (Cape Town) leads agro-export packaging: provincial agricultural exports climbed from R68.2 bn to R73.8 bn, driven by fruit and wine, underpinning demand for PET punnets and barrier trays.
What Factors are Leading to the Growth of the South Africa Thermoform Packaging Market:
Export-led demand from horticulture and agro-processing (fresh-produce punnets, clamshells, MAP trays).: Western Cape primary agricultural exports reached R66.9 billion (fruit, wine and related products), anchoring continuous demand for PET/PP punnets and retail-ready trays used in export packing lines. Durban’s container terminals processed 1,700,000 TEUs at DCT Pier 2 and 650,000 TEUs at DCT Pier 1 in the 2023/24 financial year, securing inbound polymers and outbound finished packs for horticulture exporters. South Africa’s consumer base of 64,007,187 residents supports domestic offtake for produce, bakery and chilled foods that predominantly use thermoformed formats. These macro volumes translate into stable tray and clamshell runs across Gauteng and Western Cape converter clusters.
Urban retail concentration and manufacturing base sustaining high packaging throughput (sheet-to-tray).: South Africa’s population stands at 64,007,187, concentrated around Gauteng–eThekwini–Cape Town corridors that host national retailers and food processors using thermoformed trays, punnets and cups for chilled chains. Manufacturing’s contribution is tracked by the World Bank’s “manufacturing, value added (current US$)” series, which captures multisector output feeding packaging demand; this industrial backbone, together with port logistics moving 2,350,000 TEUs through Durban’s main container terminals, underpins year-round consumption of thermoformed SKUs for meat, produce and ready meals. The dense retail network in these metros keeps SKU cycles short, sustaining steady tooling utilization and film/top-web consumption.
Power-supply stabilization and private generation improving plant uptime (reduced scrap, longer runs).: Statistics South Africa reports multiple months in 2024 where electricity generation increased versus the prior year, for example the release noting generation up in October and December; these improvements—together with an Eskom/CSIR-reported recovery in Energy Availability Factor to 60% in 2024—have coincided with reduced load-shedding incidents that previously disrupted thermoforming cycles. Reuters reported Eskom’s diesel spend of R33 billion to keep turbines running and 100 consecutive days without load-shedding by July—a context that has since improved with maintenance gains and 5 GW of private solar capacity supporting industrial users, including converters with captive PV.
Which Industry Challenges Have Impacted the Growth of the South Africa Thermoform Packaging Market:
Energy volatility still pressures conversion economics and delivery reliability.: Despite improvements, Stats SA’s 2024 electricity bulletins show month-to-month variability in generation and distribution, and Eskom’s annual disclosures point to a “higher number of load-shedding days” through 2023, reflecting a fragile recovery. Reuters noted an expected annual loss of R15 billion for Eskom tied to R33 billion diesel purchases—an indicator of systemic stress that increases the probability of unplanned curtailments. For thermoformers, every interruption raises scrap and reheat losses on APET/PP sheet, extends tooling cycles, and disrupts MAP/top-seal lines serving cold-chain customers on tight delivery windows.
Port performance and equipment constraints create inbound-resin and outbound-pack bottlenecks.: Transnet’s own disclosure shows Durban Container Terminal handling 1,700,000 TEUs (Pier 2) and 650,000 TEUs (Pier 1) in 2023/24, a scale that, without adequate crane fleets and yard equipment, can translate into berthing delays and stack congestion. Such slow-downs affect time-sensitive imports of APET/CPET sheet, additives and lidding films, and delay exports of filled produce punnets from Western Cape pack-houses. The logistics dependence of thermoforming—sheet rolls in, packed clamshells/trays out—means even short operational disruptions ripple into stock-cover spikes at converters and higher safety-inventory at packers.
Compliance workload under EPR and compulsory specs adds operational complexity.: South Africa’s Section 18 Extended Producer Responsibility regulations require producers and Producer Responsibility Organisations to register with DFFE, submit data, and finance end-of-life management for identified packaging streams. In parallel, the VC 8087 compulsory specification governs plastic carrier bags and flat bags, prescribing material and performance requirements enforced by the NRCS. While thermoformed trays/punnets are not carrier bags, multi-format converters often operate across product families and must maintain system-level compliance and traceability, including rPET chain-of-custody and product marking—adding audit steps and documentation across plants.
What are the Regulations and Initiatives which have Governed the Market:
Extended Producer Responsibility (Section 18 under NEMWA) — registration and reporting with DFFE.: The Department of Forestry, Fisheries and the Environment mandates that producers of identified products and Producer Responsibility Organisations register and comply with data-reporting and fee-financing obligations under the Regulations regarding Extended Producer Responsibility. The department’s official portal outlines the legal basis and duties; proposed 2023 amendments further refine categories and administrative provisions. For thermoform packaging, this frames rPET content claims, recyclability labelling, and end-of-life financing arrangements that pack owners and converters must align to across SKUs and customers.
NRCS Compulsory Specification VC 8087 — plastic carrier and flat bags (scope and approvals).: The NRCS enforces VC 8087:2013, a compulsory specification that sets requirements for plastic carrier bags and flat bags, including those made with recycled thermoplastics. While thermoform trays are outside this scope, many converters supply both categories; therefore, plants, quality systems and traceability often follow NRCS approval processes to ensure end-market conformance and avoid regulatory conflict across product families handled in the same facility. The NRCS also issues procedural documents on approval pathways linked to VC 8087.
Statutory measurement and consumer-protection environment — CPI tracking and labelling interfaces.: Stats SA’s Consumer Price Index publications (e.g., December 2024 release) and related official statistics are referenced in retail price-review cycles and packaging cost-pass-through discussions, intersecting with product-labelling and shelf presentation governed by national consumer frameworks. Although CPI is macro, the official index and documentation provide the measurement context retailers use when assessing packaging changes (weight, material, format) that influence on-shelf value propositions for thermoformed produce and ready-meal packs. This creates a compliance interface for converters participating in retailer standard-setting and product-change submissions.
South Africa Thermoform Packaging Market Segmentation
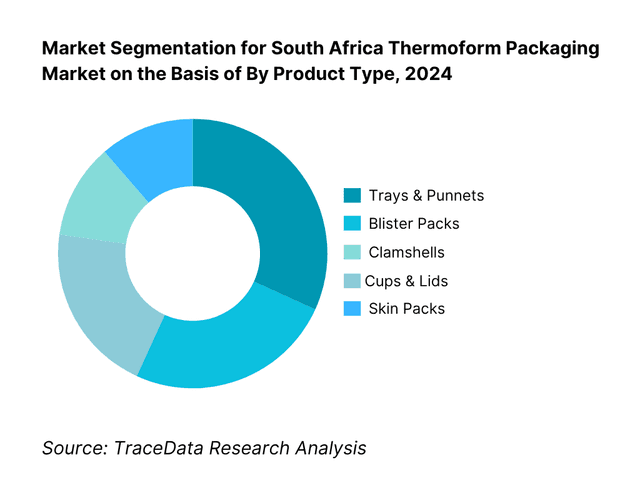
By Product Type: South Africa Thermoform Packaging market is segmented by product type into trays & punnets, blister packs, clamshells, cups & lids, and skin packs. Recently, trays & punnets have a dominant market share in South Africa under the segmentation product type, due to their central role in fresh produce and chilled foods supplied through national retailers. Western Cape fruit and horticulture export intensity and Gauteng’s retail consolidation sustain high tray turnover, while Durban’s port throughput secures PET/PP inputs. Blister packs expand with pharma and OTC categories, but produce distribution breadth keeps trays & punnets on top.
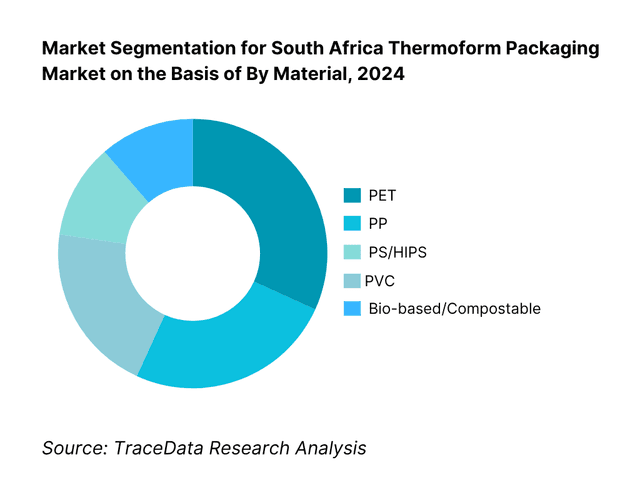
By Material: South Africa Thermoform Packaging market is segmented by material into PET, PP, PS/HIPS, PVC, and bio-based sheets. PET currently dominates the material mix, driven by its clarity, impact resistance, and established recycling streams (notably for food punnets and clamshells). PET’s compatibility with rPET targets under the SA Plastics Pact and brand-owner recyclability commitments supports continued preference in produce and bakery. PP follows in hot-fill or microwaveable ready-meal trays, while PS/HIPS remains present in dairy and meat inserts; PVC use continues to decline in retail due to recyclability concerns.
Competitive Landscape in South Africa Thermoform Packaging Market
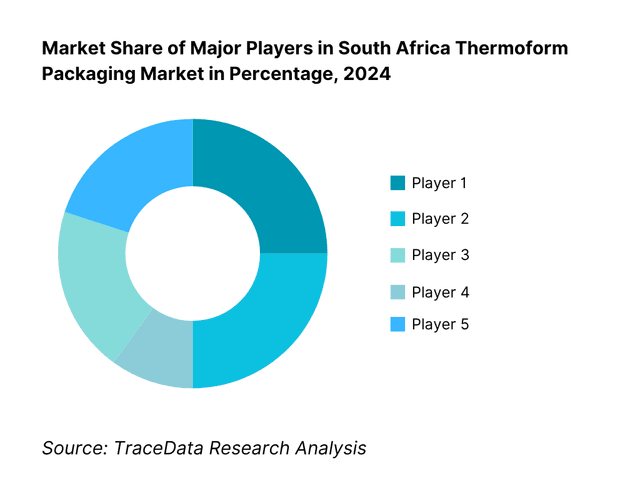
The South Africa thermoform packaging landscape skews toward a concentrated core of integrated converters supplying national grocers, fresh-produce exporters and healthcare packers. Local majors (e.g., Mpact, Nampak, Polyoak/ Thermopac, Astrapak under Berry) anchor food trays, punnets and dairy; multinationals (Huhtamaki) serve ready-meal and specialty applications. The mix reflects scale, downstream relationships with retailers/brand owners, and proximity to ports and horticulture belts.
Name | Founding Year | Original Headquarters |
Mpact Plastics | 1950s | Johannesburg, South Africa |
Nampak Plastics | 1960s | Johannesburg, South Africa |
Polyoak Packaging (Thermopac) | 1970s | Cape Town, South Africa |
Berry Global (RPC Astrapak) | 1980s | Durban, South Africa |
Huhtamaki South Africa | 1920 | Springs, South Africa |
Paccor Packaging | 1969 | Düsseldorf, Germany |
Boxmore Plastics (CCL Industries) | 1995 | Johannesburg, South Africa |
Transpaco | 1980s | Johannesburg, South Africa |
Amcor (SA operations) | 1860 | Zürich, Switzerland |
Mondi Group (rigid-flex interface) | 1967 | Johannesburg, South Africa |
Lovell Industries | 1970s | Durban, South Africa |
Cibapac | 1980s | Johannesburg, South Africa |
Dispak / Blisterpack | 1980s | Johannesburg, South Africa |
Grand Forming | 1990s | Johannesburg, South Africa |
Zibo Containers | 1980s | Pretoria, South Africa |
Some of the Recent Competitor Trends and Key Information About Competitors Include:
Mpact Plastics: As one of South Africa’s largest rigid and thermoform packaging producers, Mpact expanded its rPET thermoform line capacity in 2024, enabling production of trays and punnets with up to 100% recycled content. This aligns with SA Plastics Pact goals and strengthens its leadership in produce and bakery packaging.
Nampak Plastics: Leveraging its broad FMCG and dairy client base, Nampak invested in upgrading its thermoforming tooling to support lightweight PP and PET trays. The move responds to retailer sustainability scorecards and helps meet demand for recyclable dairy tubs and meat packaging formats.
Polyoak Packaging (Thermopac): Known for its presence in ready-meal and QSR packaging, Thermopac introduced dual-ovenable CPET tray ranges in 2024. These innovations target the growing convenience foods sector and offer compatibility with both microwave and conventional ovens, enhancing consumer usability.
Berry Global (RPC Astrapak): RPC Astrapak strengthened its South African portfolio with PCR-based thermoform packaging solutions in 2024. The company’s focus has been on dairy and bakery packaging, with new clamshell and lid designs that reduce material weight while maintaining rigidity.
Huhtamaki South Africa: A major player in airline and retail meal packaging, Huhtamaki introduced barrier-optimized CPET trays for ready-meals in 2024. These trays are designed for recyclability and reduced carbon footprint, aligning with Huhtamaki’s global sustainability commitments and catering to both local and export-ready meal producers.
What Lies Ahead for South Africa Thermoform Packaging Market?
The South Africa thermoform packaging market is projected to grow steadily through 2030, supported by the continued rise of fresh-produce exports, growth in ready-meal consumption, and policy emphasis on circular economy practices under the Department of Forestry, Fisheries and the Environment. Strong urban consumption in Gauteng and Cape Town, coupled with Durban’s container-port throughput, will ensure sustained demand for trays, clamshells, and blisters, while recyclability targets and investment in rPET capacity will shape material choices and converter strategies.
Rise of rPET and Circular Packaging Models: The market will increasingly adopt rPET thermoform trays and clamshells, driven by national EPR compliance and brand-owner commitments. This trend reflects both government regulations and consumer preference for visibly sustainable packaging.
Shift Toward Ready-Meal and Convenience Formats: With rapid urbanization and a consumer base of over 64 million people, the demand for dual-ovenable CPET trays and microwave-safe punnets will grow. Retailers are expanding ready-meal SKUs, creating sustained momentum for thermoformed packaging solutions.
Expansion of Sector-Specific Applications: Beyond food, medical and pharmaceutical blister packaging is expected to gain greater relevance, especially as healthcare investments rise and local production of OTC drugs expands, requiring high-barrier thermoformed packs.
Leveraging Automation and Smart Tooling: Thermoform converters will increasingly integrate robotics, in-line forming/sealing, and rapid digital tooling. These investments will improve precision, reduce scrap, and align with global best practices, strengthening South Africa’s competitiveness in both domestic and export packaging supply.
South Africa Thermoform Packaging Market Segmentation
By Product Type
Trays & Punnets
Blister Packs
Clamshells & Hinged Containers
Cups, Tubs & Lids
Dual-Ovenable Meal Trays (CPET)
Medical/Device Trays
Inserts & Dunnage Trays
By Material
APET / rPET
CPET
PP / PP-EVOH
PS / HIPS
PVC (legacy/declining)
Bio-based & Compostable Sheets
By End-Use Industry
Fresh Meat & Poultry (MAP / Skin)
Fresh Produce & Berries
Bakery & Confectionery
Dairy & Spreads
Ready-Meals & Food-to-Go
Pharmaceuticals & OTC (Blister/Tray)
Industrial Handling & Components
By Forming Process
Vacuum-Formed
Pressure-Formed
Twin-Sheet Thermoforming
In-Line Form-Fill-Seal (FFS)
By Closure / Sealing Format
Top-Seal (MAP)
Hinged Clamshell
Snap-Fit / Press-On Lids
Skin-Pack Compatible
Players Mentioned in the Report:
Mpact Plastics
Nampak Plastics
Polyoak Packaging / Thermopac
Berry Global (RPC Astrapak)
Huhtamaki South Africa
Paccor (regional imports/support)
Mpact Versapak (produce)
CTP Flexibles / allied rigid partners
Boxmore Plastics (a CCL company; trays/clamshells where applicable)
Tubs & Trays SA (specialty thermoforming)
Transpaco (rigid/flexible interface; trays where applicable)
Amcor (regional imports and specialty formats)
Mondi (rigid-flex systems; thermoformed lids in programs)
Astrapak Plastop (Berry)
Nalli (regional produce packaging supplier)
Key Target Audience
Food retailers (national supermarket chains)
Fresh-produce exporters & pack-houses (Western Cape Department of Agriculture; HORTGRO)
Meat, poultry & seafood processors (MAP & skin-pack users)
Ready-meal manufacturers & airline caterers
Pharmaceutical & OTC packaging buyers (with NRCS/SAPC compliance)
Investments and venture capitalist firms (packaging & food systems portfolios)
Government & regulatory bodies
Producer Responsibility Organisations (PROs) & EPR scheme operators
Key Target Audience
Time Period:
Historical Period: 2019-2024
Base Year: 2025
Forecast Period: 2025-2030
Explore Flexible Purchase Options or Have Limited Budget?
Pay only for relevant chapters • Customizable report sections
Table of Contents
Choose individual sections to purchase. Mix and match as you like.
4.1. Forming Model Analysis (vacuum-formed, pressure-formed, twin-sheet, in-line FFS; margins, efficiency, strengths & weaknesses)
4.2. Revenue Streams for Thermoform Packaging Market (direct sales to packers; OEM-integrated supply; retail private labels; food service contracts; pharma packs; exports)
4.3. Business Model Canvas for South Africa Thermoform Packaging Market (key partners, cost structure, revenue models, customer segments)
5.1. Small & Mid-size Converters vs Integrated Multinationals (capacity bands, sheet-to-tray depth, in-house tooling)
5.2. Investment Model in South Africa Thermoform Packaging Market (capex on extrusion/thermoform lines; energy mitigation; rPET plants)
5.3. Comparative Analysis of Packaging Adoption by Organized Retail vs Informal Trade (private labels, produce exports, informal FMCG)
5.4. Packaging Budget Allocation by Retailer & Packer Size (large packers, medium-scale fresh-produce exporters, SMEs)
8.1. Revenues (converter sales, packer spend, retail SKU mapping)
9.1. By Market Structure (In-House vs Outsourced Converters)
9.2. By Product Type (Trays & Clamshells, Punnets, Tubs, Blisters, Dual-ovenable CPET)
9.3. By End-Use Industry (Meat & Poultry, Fresh Produce, Dairy, Ready-Meals, Pharmaceuticals, Bakery & Confectionery)
9.4. By Company Size (large integrated packers vs SME converters)
9.5. By Material (APET/rPET, CPET, PP, HIPS, PVC)
9.6. By Mode of Closure (Top-seal MAP, Hinged clamshells, Snap-fit lids)
9.7. By Customized vs Standard Programs (bespoke tooling vs catalog trays)
9.8. By Region (Gauteng, Western Cape, KwaZulu-Natal, Eastern Cape, Rest of South Africa)
10.1. Corporate/Industry Client Landscape (packers, retailers, medical suppliers)
10.2. Procurement Needs & Decision-Making Process (price corridors, sustainability scorecards, shelf-life extension drivers)
10.3. Packaging Effectiveness & ROI Analysis (MAP shelf-life gains, rPET branding impact, cost-per-SKU)
10.4. Gap Analysis Framework (recyclability vs cost, supply vs demand of rPET, retail penetration gaps)
11.1. Trends & Developments (rPET share growth, MAP adoption, EPS phase-out, monomaterial trays)
11.2. Growth Drivers (protein demand, produce exports, sustainability pressure, automation adoption)
11.3. SWOT Analysis (polymer portfolio, rPET reliance, retailer leverage, tooling bottlenecks)
11.4. Issues & Challenges (EPR compliance costs, energy security, resin volatility, competition from flexibles)
11.5. Government Regulations (EPR framework, recyclability labeling, SANS standards, import duties)
12.1. Market Size & Future Potential (in-line FFS, multilane MAP sealing, robotics integration)
12.2. Business Models & Revenue Streams (machine sales vs service; converter-OEM tie-ups)
12.3. Forming Models & Types of Packs (FFS trays, MAP packs, CPET lines)
15.1. Market Share of Key Players (converter sales, tray volumes, SKUs by category)
15.2. Benchmark of Competitors (Company Overview, USP, Business Strategies, Polymer Slate, Number of SKUs, Revenues, Technology Used, Certifications, Strategic Tie-Ups, Major Retail Clients, Recent Developments)
15.3. Operating Model Analysis Framework (integrated sheet-to-tray vs outsourced sheet supply)
15.4. Gartner Magic Quadrant (leaders, challengers, visionaries, niche players)
15.5. Bowman’s Strategic Clock (pricing vs differentiation strategies)
16.1. Revenues (converter & packer spend projections)
17.1. By Market Structure (In-House and Outsourced Converters)
17.2. By Product Type (Trays, Punnets, Blisters, CPET, Lids)
17.3. By End-Use Industry (Meat, Produce, Dairy, Ready-Meals, Pharma, Bakery)
17.4. By Company Size (large packers, SMEs, exporters)
17.5. By Material (APET/rPET, CPET, PP, HIPS, PVC)
17.6. By Closure Type (top-seal, skin, clamshell, snap-lid)
17.7. By Customized vs Standard Packs (bespoke tooling, catalog SKUs)
17.8. By Region (Gauteng, Western Cape, KwaZulu-Natal, Eastern Cape, Rest of South Africa)
Discuss a Customized Research Scope
Custom research scope • Tailored insights • Industry expertise
Research Methodology
Step 1: Ecosystem Creation
Map the end-to-end South Africa Thermoform Packaging ecosystem across demand and supply. Demand-side: national grocers and wholesalers, fresh-produce exporters/pack-houses (berries, grapes, citrus), meat & poultry processors (MAP/skin), ready-meal manufacturers and airline caterers, dairy & bakery brands, and pharmaceuticals/OTC packers using blisters and medical trays. Supply-side: resin & rPET flake suppliers, sheet extruders (APET/rPET/CPET/PP/HIPS), thermoform converters, lidding/top-web film makers, MAP/FFS/top-seal OEMs, toolrooms, PROs (EPR), logistics/ports (Durban, Cape Town), certifiers (BRC/FSSC/SABS), and regulators (DFFE/NRCS). From this map, shortlist 5–6 leading converters by revenue footprint, installed forming/extrusion capacity, certification stack, and national retail penetration. Sourcing approach: compile entities and screen leaders via industry articles, company registries, annual filings, tender portals, customs/port bulletins, and proprietary databases to consolidate ecosystem and company-level facts for desk research.
Step 2: Desk Research
Conduct exhaustive desk research using diversified secondary and proprietary sources to assemble a structured fact base. Build market ledgers covering: converter revenues and capacity (sheet ktpa, forming lanes), product mix (trays, punnets, CPET, blisters), end-use exposure (produce, meat, dairy, ready-meals, pharma), material mix (APET/rPET/CPET/PP/HIPS), certification stack (BRC/FSSC/ISO), and EPR alignment (PRO membership, recyclability claims). Layer in operating context: port throughput, power availability releases, retail SKU expansion, and provincial agro-export bulletins. At the company level, mine press releases, financial statements, environmental/product datasheets, and certification directories to validate plants, tooling capability, customer programs, and recent investments (e.g., rPET lines, automation, new MAP cells).
Step 3: Primary Research
Run semi-structured interviews with C-suite and plant leadership at converters, sheet suppliers, MAP/FFS OEMs, lidding film makers, and large packers/retail private-label teams. Objectives: (i) validate hypotheses on dominant formats (punnets/trays vs blisters), materials (PET/rPET vs PP/CPET) and route-to-market; (ii) authenticate statistics on capacity, utilization, lead-times, rPET content, scrap rates, and certification scope; (iii) extract operating and financial insights (price corridors, tooling queues, changeover frequency, rejection rates, service-level norms). Apply a bottom-to-top approach to attribute revenue and volume by player and segment, and triangulate with top-down indicators (retail/SKU density, produce export volumes, port flows). As part of validation, include disguised buyer interactions where appropriate to corroborate quotes, MOQs, and service metrics against secondary data.
Step 4: Sanity Check
Execute dual-track modeling: (a) bottom-up from converter capacity (sheet output × yield to trays/punnets/blisters × run rates × scrap adjustments) and OEM install base; (b) top-down from end-use volumes (produce export packs, meat MAP trays, ready-meal ranges, pharma blister counts) normalized by pack-to-product ratios. Perform bridge reconciliations between tracks, resolve deltas via sensitivity on gauge mix, changeover efficiency, and rPET share, and re-interview for outliers. Finalize a balanced market model with clearly tagged assumptions, confidence bands by segment, and an audit trail linking every datapoint to a primary disclosure, official bulletin, or verified interview note.
See What's Inside the Report
Get a preview of key findings, methodology and report coverage
Frequently Asked Questions
The South Africa Thermoform Packaging Market holds significant potential, with strong demand across fresh-produce exports, meat and poultry MAP trays, and ready-meal packaging. The market’s momentum is underpinned by Gauteng’s concentration of manufacturing and retail distribution, the Western Cape’s R66.9 billion agricultural export sector, and Durban’s role in handling over 2.3 million TEUs annually. Growing urban consumption, coupled with mandatory Extended Producer Responsibility regulations, ensures sustained demand for trays, clamshells, and blister packs across food and healthcare applications.
The South Africa Thermoform Packaging Market features several leading players, including Mpact Plastics, Nampak Plastics, Polyoak Packaging (Thermopac), Berry Global (RPC Astrapak), and Huhtamaki South Africa. These companies dominate through integrated thermoforming capacity, extensive distribution networks, and deep retailer and exporter relationships. Other notable converters include Zibo Containers, Lovell Industries, Cibapac, Dispak, and Boxmore Plastics, which serve niche categories in produce, dairy, bakery, and pharma packaging.
Key growth drivers include South Africa’s expanding horticultural exports valued at R66.9 billion, which rely heavily on PET punnets and clamshells for international compliance. Rising urban demand among 64 million residents sustains trays and ready-meal packaging, particularly in Gauteng and Cape Town metros. Additionally, regulatory frameworks mandating recyclability and higher rPET incorporation are accelerating converter investments in sheet extrusion and in-line thermoforming, ensuring long-term scalability and alignment with global sustainability standards.
The South Africa Thermoform Packaging Market faces challenges including unstable electricity supply, which has led to periods of extensive load-shedding and raised operational risks for converters. Logistics disruptions at Durban Container Terminal, which handled 2.35 million TEUs in 2023/24, create inbound and outbound bottlenecks for resin and finished packs. Compliance pressures under Section 18 Extended Producer Responsibility regulations also increase costs for converters, requiring rigorous reporting, recyclability labeling, and PRO registration across multiple packaging categories.
License Options
PDF + Excel
Complete report package
$4,000
Excel Only
Data and analytics
$2,500
Custom Sections
Starts from $100
$0