Taiwan Logistics and Warehousing Market Outlook to 2029
By Mode of Transport, By Type of Services, By End-User Industry, By Region, and By Type of Warehousing
Report Overview
Report Code
TDR0181
Coverage
Asia
Published
May 2025
Pages
80
Flexible Purchase Options
Select and purchase only the chapters you need for your strategic decisions
On This Page
Report Overview
The report titled “Taiwan Logistics and Warehousing Market Outlook to 2029 – By Mode of Transport, By Type of Services, By End-User Industry, By Region, and By Type of Warehousing” provides a comprehensive analysis of the logistics and warehousing industry in Taiwan. The report covers an overview and genesis of the industry, overall market size in terms of revenue, market segmentation; trends and developments, regulatory landscape, customer level profiling, issues and challenges, and comparative landscape including competition scenario, cross comparison, opportunities and bottlenecks, and company profiling of major players in the Taiwan logistics and warehousing market.
Report Coverage
Verified Market Sizing
Multi-layer forecasting with historical data and 5–10 year outlook
Deep-Dive Segmentation
Cross-sectional analysis by product type, end user, application and region
Competitive Benchmarking & Positioning
Market share, operating model, pricing and competition matrices
Actionable Insights & Risk Assessment
High-growth white spaces, underserved segments, technology disruptions and demand inflection points
Review Methodology & Data Structure
Preview report structure, data sources and research framework
Executive Summary
The report titled “Taiwan Logistics and Warehousing Market Outlook to 2029 – By Mode of Transport, By Type of Services, By End-User Industry, By Region, and By Type of Warehousing” provides a comprehensive analysis of the logistics and warehousing industry in Taiwan. The report covers an overview and genesis of the industry, overall market size in terms of revenue, market segmentation; trends and developments, regulatory landscape, customer level profiling, issues and challenges, and comparative landscape including competition scenario, cross comparison, opportunities and bottlenecks, and company profiling of major players in the Taiwan logistics and warehousing market. The report concludes with future market projections based on revenue by segment, transport type, region, and success case studies highlighting the major opportunities and cautions.
Taiwan Logistics and Warehousing Market Overview and Size
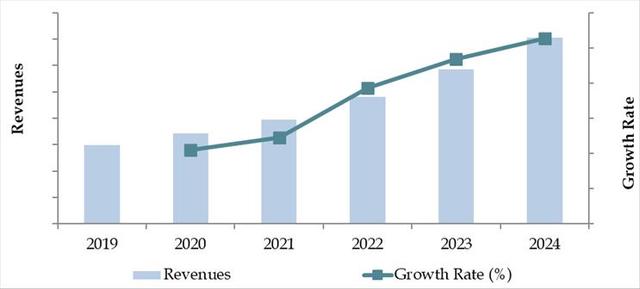
The Taiwan logistics and warehousing market was valued at TWD 280 Billion in 2023, driven by the country's strategic geographic location, booming e-commerce sector, and robust industrial base. The market is shaped by key players such as Kerry TJ Logistics, Dimerco Express, HCT Logistics, Evergreen Logistics, and Yamato Transport. These companies are known for their integrated logistics solutions, expansive warehouse networks, and investment in automation and digitalization.
In 2023, Kerry TJ Logistics expanded its smart warehouse capacity in Taoyuan to cater to growing demand from the FMCG and electronics sectors. Taipei, Taichung, and Kaohsiung remain critical logistics hubs due to their port access, infrastructure, and dense industrial clusters.
Market Size for Taiwan Logistics and Warehousing Industry on the Basis of Revenue in USD Billion, 2018-2024
What Factors are Leading to the Growth of Taiwan Logistics and Warehousing Market:
E-commerce Boom: The exponential growth of e-commerce has led to increased demand for efficient last-mile delivery and real-time inventory management. In 2023, Taiwan recorded over 380 million online shopping transactions, creating a significant need for warehousing and logistics support across urban and semi-urban regions.
Government Investment in Infrastructure: Taiwan’s government has invested over TWD 200 billion in transportation infrastructure improvements under the Forward-looking Infrastructure Development Program. Upgrades to port facilities, highways, and rail freight lines have enhanced overall logistics efficiency.
Smart Warehousing Adoption: Rising labor costs and the need for accuracy have led to the widespread adoption of smart warehousing solutions. Technologies like automated guided vehicles (AGVs), warehouse management systems (WMS), and IoT tracking are increasingly deployed by top logistics providers.
Which Industry Challenges Have Impacted the Growth for Taiwan Logistics and Warehousing Market
Rising Operational Costs: Taiwan’s logistics sector faces increasing costs related to fuel, labor, and facility rentals. In 2023, warehouse rental prices in Taipei and Taoyuan surged by 9–12%, squeezing profit margins for logistics service providers. Fuel prices also remained volatile, contributing to an overall 7% increase in transportation costs year-over-year.
Labor Shortage and Aging Workforce: The logistics industry in Taiwan is experiencing a talent crunch, particularly for warehouse operators, drivers, and skilled IT staff. With over 33% of the logistics workforce aged above 50, the industry is at risk of long-term labor shortages unless automation and workforce reskilling efforts are accelerated.
Limited Land Availability for Warehousing: Due to Taiwan's dense urban planning and mountainous terrain, land for new warehousing infrastructure is scarce, especially near key logistics hubs like Taipei and Kaohsiung. In 2023, industrial land vacancy rates in prime logistics zones were under 2.5%, severely restricting expansion capacity.
What are the Regulations and Initiatives Which Have Governed the Market
Green Logistics Initiatives: Taiwan’s Ministry of Transportation and Communications (MOTC) has launched several sustainability mandates, including fuel efficiency benchmarks and carbon reduction targets for logistics fleets. As of 2023, over 28% of logistics providers in Taiwan had begun integrating electric delivery vehicles or low-emission solutions into their operations.
Free Trade Zone (FTZ) Reforms: Recent reforms in FTZ policies aim to ease customs procedures and reduce turnaround time for transshipment goods. As of 2023, goods processed through FTZs enjoyed an average customs clearance time of under 6 hours, improving Taiwan's competitiveness as a regional hub.
Warehousing Safety and Compliance Codes: The Taiwan Occupational Safety and Health Administration (OSHA) mandates rigorous warehouse safety standards covering fire prevention, worker protection, and automation system integrity. In 2022, OSHA audits led to temporary closures of 3.4% of warehouses due to non-compliance, pushing operators toward stricter safety adherence.
Taiwan Logistics and Warehousing Market Segmentation
By Market Structure: The logistics market in Taiwan is predominantly organized, with large integrated logistics players managing end-to-end supply chains for major industries including electronics, FMCG, and pharmaceuticals. These players offer superior infrastructure, digital tools for real-time tracking, and compliance with global standards. However, the unorganized segment—comprising small-scale trucking, storage operators, and local courier services—continues to serve last-mile and rural delivery needs. Their low-cost operations and local familiarity make them relevant in Tier 2 and Tier 3 cities.
By End-User Industry: The electronics and semiconductor sectors dominate logistics demand due to Taiwan’s strong manufacturing base in these industries. Timely and precise delivery is critical, driving demand for high-reliability logistics partners. E-commerce follows closely, supported by rising online shopping volumes and increasing consumer expectations for fast, low-cost delivery. The FMCG and healthcare sectors also represent growing demand verticals, relying on temperature-controlled and just-in-time logistics solutions.
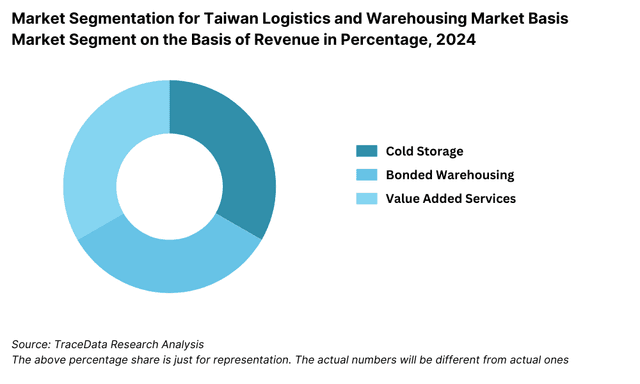
By Type of Warehousing: General warehousing continues to hold the largest share, serving retail, consumer goods, and basic industrial storage needs. However, cold storage and bonded warehousing are rapidly expanding segments. With Taiwan’s growing pharmaceutical exports and fresh food imports, temperature-controlled warehousing has seen a CAGR of 11% from 2018 to 2023. Bonded warehouses are also key for transshipment and re-export activities.
Competitive Landscape in Taiwan Logistics and Warehousing Market
The Taiwan logistics and warehousing market is moderately concentrated, with a mix of established multinational players and regional logistics firms. The market is seeing growing competition due to technological advancements and increased demand for customized logistics solutions. Major players such as Kerry TJ Logistics, Dimerco Express, HCT Logistics, Evergreen Logistics, Yamato Transport, and Chi Lin Technology are actively expanding their service portfolios and digital capabilities to gain a competitive edge.
| Company Name | Founding Year | Original Headquarters |
| E. Sun Logistics Co., Ltd. | 1992 | Taipei, Taiwan |
| Kerry TJ Logistics (Taiwan) | 1930 (as Taiwan Jiun) | Taipei, Taiwan |
| Taiwan Pelican Express Co., Ltd. | 2000 | Taipei, Taiwan |
| President Transnet Corp. | 2000 | Taipei, Taiwan |
| CTW Logistics Corporation | 1982 | Taoyuan, Taiwan |
| HCT Logistics Co., Ltd. | 1938 | Taipei, Taiwan |
| Trade Van (Data Logistics) | 1990 | Taipei, Taiwan |
| DHL Express Taiwan | 1969 (Taiwan: ~1980s) | Bonn, Germany |
| DB Schenker Taiwan | 1872 (Taiwan: ~1990s) | Essen, Germany |
| Kuehne + Nagel Taiwan Ltd. | 1890 (Taiwan: ~1990s) | Schindellegi, Switzerland |
| CEVA Logistics Taiwan | 2006 (Taiwan: ~2007) | Marseille, France |
| UPS Taiwan | 1907 (Taiwan: ~1988) | Atlanta, USA |
| FedEx Taiwan | 1971 (Taiwan: ~1990) | Memphis, USA |
| Maersk Taiwan Ltd. | 1904 (Taiwan: ~2000s) | Copenhagen, Denmark |
| Yusen Logistics Taiwan | 1955 (Taiwan: ~1990s) | Tokyo, Japan |
| Nippon Express Taiwan | 1937 (Taiwan: ~1970s) | Tokyo, Japan |
Some of the recent competitor trends and key information about competitors include:
Kerry TJ Logistics: One of the leading logistics providers in Taiwan, Kerry TJ Logistics expanded its smart warehousing facilities in northern Taiwan in 2023 to support rising demand from electronics and FMCG sectors. The firm also launched AI-powered warehouse management systems (WMS) to enhance real-time inventory tracking.
Dimerco Express: A key player in international freight forwarding, Dimerco achieved 18% year-on-year growth in cross-border logistics in 2023, particularly serving semiconductor and high-tech exports. The company also enhanced its air-sea transport integration model to improve supply chain agility.
HCT Logistics: Focused on B2C and last-mile delivery services, HCT Logistics introduced electric delivery vans across metropolitan routes in 2023. The company now operates over 200 eco-friendly vehicles and reported a 14% reduction in delivery times through optimized route planning.
Evergreen Logistics: A subsidiary of Evergreen Group, it specializes in sea freight and containerized logistics. In 2023, it opened a new bonded warehouse near the Port of Kaohsiung to support transshipment and re-export activities, contributing to a 22% increase in regional shipments.
Yamato Transport Taiwan: Known for its strong last-mile delivery services, Yamato launched temperature-controlled logistics for pharma and fresh food sectors in 2023. The company has rapidly expanded its cold-chain infrastructure across major cities.
Chi Lin Technology: Specializing in logistics automation and smart warehouse solutions, Chi Lin saw a 25% increase in contracts from e-commerce clients in 2023. Its proprietary robotics and automation modules are increasingly adopted by warehouse operators across central Taiwan.
What Lies Ahead for Taiwan Logistics and Warehousing Market?
The Taiwan logistics and warehousing market is projected to witness steady growth through 2029, driven by rapid digitization, growing e-commerce penetration, and infrastructure modernization. The market is expected to register a healthy CAGR during the forecast period, supported by technological innovation and increased demand for efficient supply chain solutions.
Expansion of Smart Warehousing: The adoption of AI, robotics, and IoT in warehousing operations is expected to accelerate. Smart warehouses equipped with automated guided vehicles (AGVs), real-time tracking, and predictive inventory management will enhance operational efficiency and reduce human dependency. These advancements are particularly relevant in overcoming Taiwan's labor shortage and optimizing urban warehousing.
Rising Demand for Cold Chain Logistics: With increasing demand from pharmaceutical, biotechnology, and fresh food sectors, the cold chain logistics segment is poised for strong growth. Taiwan's export-oriented pharma industry, along with rising health-conscious consumer behavior, will drive investment in temperature-controlled storage and last-mile cold deliveries.
Sustainability and Green Logistics Initiatives: Environmental sustainability will become a key focus, with logistics providers investing in electric fleets, energy-efficient warehouses, and carbon-neutral logistics solutions. Taiwan’s Green Transport Program and emission reduction mandates will further accelerate adoption. By 2029, it is expected that over 40% of urban delivery fleets will be hybrid or fully electric.
Regional Transshipment and Free Trade Zone Expansion: Taiwan is likely to strengthen its position as a regional logistics hub by expanding Free Trade Zones (FTZs) and enhancing port logistics. The proximity to major East and Southeast Asian economies, coupled with streamlined customs procedures, will make Taiwan a critical node in Asia’s supply chain ecosystem.
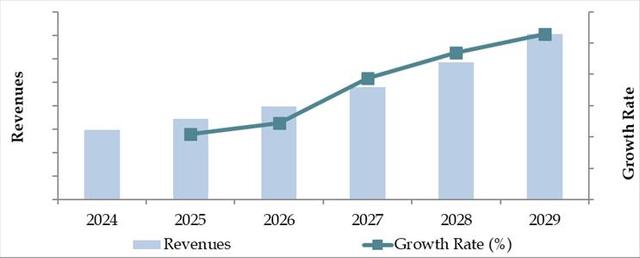
Future Outlook and Projections for Taiwan Logistics and Warehousing Market on the Basis of Revenues in USD Billion, 2024-2029
Taiwan Logistics and Warehousing Market Segmentation
- By Market Structure:
- Organized Logistics Service Providers
- Independent Warehousing Operators
- Third-Party Logistics (3PL) Providers
- Fourth-Party Logistics (4PL) Coordinators
- Courier, Express & Parcel (CEP) Providers
- Freight Forwarders
- Cold Chain Logistics Providers
- By Mode of Transport:
- Road Freight
- Rail Freight
- Air Cargo
- Sea Freight
- Intermodal Transport
- By Type of Warehousing:
- General Warehousing
- Bonded Warehousing
- Cold Storage Warehousing
- Automated Warehousing
- E-Commerce Fulfillment Centers
- By End-User Industry:
- Electronics and Semiconductors
- E-Commerce and Retail
- FMCG
- Pharmaceuticals and Healthcare
- Automotive
- Chemicals
- Agriculture and Food Processing
- By Region:
- Northern Taiwan (Taipei, New Taipei, Taoyuan)
- Central Taiwan (Taichung, Changhua, Miaoli)
- Southern Taiwan (Kaohsiung, Tainan, Pingtung)
- Eastern Taiwan (Hualien, Taitung)
- Offshore Islands (Penghu, Kinmen, Matsu)
Players Mentioned in the Report:
Freight Forwarding Companies
- Dimerco Express Group
- JAS Worldwide Taiwan
- Mainfreight Taiwan
- Bolloré Logistics Taiwan
- Air Tiger Express Taiwan
- QA Transport Co. Ltd.
- Korchina Logistics Holdings Ltd.
- Hecny Transportation (Taiwan) Ltd.
- Mako Transport Co., Ltd.
- Great China Transportation Co., Ltd.
- Asia Access Express Co., Ltd.
- Fortune Transportation Corporation
- ShanLoong International & Customs Broker Co., Ltd.
- Sun Ocean & Air Logistics Co., Ltd.
- DocShipper
- Airlife Freight (Taiwan) Corp.
- 3L-Leemark Logistics
- Symatrans Express
- Jia Yunn Express
- Agility Logistics
- Omni Logistics Taiwan
- MENQ Logistics
- Crane Worldwide Logistics Taiwan
- All-The-Way Express (Taiwan) Co., Ltd
Warehousing Companies
- Dimerco Express Group
- Mainfreight Taiwan
- Nippon Express (Taiwan) Co., Ltd.
- Omni Logistics Taiwan
- Rinchem Taiwan
- CTW Logistics Corporation
- YES Logistics Corporation
- Choice E-Logistics
- Logistic Republic
- One Union Solutions
- TRIUMPH EXPRESS SERVICE
- UNITOP Logistics Corporation
- Toyota Tsusho (Taiwan) Co., Ltd.
- Transcentral Integrated Logistics
- Centurion Logistics Services
E-Commerce Logistics Companies
- FedEx Taiwan
- DHL Express Taiwan
- Choice E-Logistics
- MENQ Logistics
- e-Commerce Logistics (Taiwan) Corporation Limited
- TGL Group
- SGS Taiwan
- Shopee Taiwan (SPX Express)
Express Logistics Companies
DHL Express Taiwan
FedEx Taiwan
UPS Taiwan
Aramex Taiwan
Taiwan Pelican Express Co., Ltd.
T-Cube Global Logistics
T3EX Global Holdings
Key Target Audience:
- 3PL and 4PL Providers
- Warehousing and Cold Chain Operators
- Freight Forwarding Companies
- E-Commerce and Retail Companies
- Manufacturing and Export Enterprises
- Government and Regulatory Bodies (e.g., Ministry of Transportation and Communications)
- Industrial Real Estate Developers
- Technology Providers (WMS, IoT, Robotics)
- Investment and Infrastructure Funds
Time Period:
- Historical Period: 2018–2023
- Base Year: 2024
- Forecast Period: 2024–2029
Explore Flexible Purchase Options or Have Limited Budget?
Pay only for relevant chapters • Customizable report sections
Table of Contents
Choose individual sections to purchase. Mix and match as you like.
4.1. Macroeconomic framework for Taiwan Including GDP (2018-2024), GDP Growth (2018-2024), GDP Contribution by Sector
4.2. Logistics Sector Contribution to GDP and how the contribution has been changing in the historical assessment
4.3. Ease of Doing Business in Taiwan
4.4. LPI Index of Taiwan and Improvements in the last 10-15 Years
4.5. Custom Procedure and Custom Charges in Taiwan Logistics market
5.1. Landscape of Investment Parks and Free Trade Zones in Taiwan
5.2. Current Scenario for Logistics Infrastructure in Taiwan
5.3. Road Infrastructure in Taiwan including Road Network, Toll Charges and Toll Network, Major Goods Traded through Road, Major Flow Corridors for Road (Inbound and Outbound)
5.4. Air Infrastructure in Taiwan including Total Volume Handled, FTK for Air Freight, Major Inbound and Outbound Flow Corridors, Major Goods traded through Air, Number of Commercial and passenger Airports, Air Freight Volume by Ports and other Parameters
5.5. Sea Infrastructure in Taiwan including Total Volume Handled, FTK for Sea Freight, Major Inbound and Outbound Flow Corridors, Major Goods Traded through Sea, Number of Ports for Coastal and Ocean Freight, Number of Vessels, Sea Freight Volume by Ports and other Parameters
5.6. Rail Infrastructure in Taiwan including Total Volume Handled, FTK for Rail Freight, Major Inbound and Outbound Flow Corridors, Major Goods Traded through Rail and others
6.1. Basis Revenues, 2018-2024P
7.1. By Segment (Freight Forwarding, Warehousing, CEP and Value-Added Services), 2018-2024P
7.2. By End User Industries, 2018-2024P
8.1. Market Overview and Genesis
8.2. Taiwan Freight Forwarding Market Size by Revenues, 2018-2024P
8.3. Taiwan 3PL Freight Forwarding Market Segmentation, 2018-2024P
8.3.1. By Mode of Freight Transport (Road, Sea, Air and Rail), 2018-2024P
8.3.1.1. Price per FTK for Road/Air/Sea and Rail in Taiwan
8.3.1.2. Road Freight (Domestic and International Volume, FTK and Revenue; Number of Registered Vehicles)
8.3.1.3. Road Freight Domestic and International Corridors
8.3.1.4. Ocean Freight (Domestic and International Volume, FTK and Revenue; Volume by Commodity; Sea Ports Key Statistics)
8.3.1.5. Air Freight (Domestic and International Volume, FTK and Revenue)
8.3.1.6. Rail Freight (Domestic and International Volume, FTK and Revenue; Volume by Commodity and Region)
8.3.1.7. Export-Import Scenario (Value by Mode of Transport, Commodity and Country; Volume by Principal Commodities)
8.3.2. By Intercity Road Freight Corridors, 2018-2024P
8.3.3. By International Road Freight Corridors (China, Thailand and Taiwan), 2018-2024P
8.3.4. By End User (Industrial, FMCG, F&B, Retail and Others), 2018-2024P
8.4. Snapshot of Freight Truck Aggregators in Taiwan Including Company Overview, USP. Business Strategies, Future Plans, Business Model, Number of Fleets, Margins/Commission, Number of Booking, Major Clients, Average Booking Amount, Major Routes and others
8.5. Competitive Landscape in Taiwan Freight Forwarding Market, 2021
8.5.1. Heat Map of Major Players in Taiwan Freight Forwarding on the Basis of Service offering
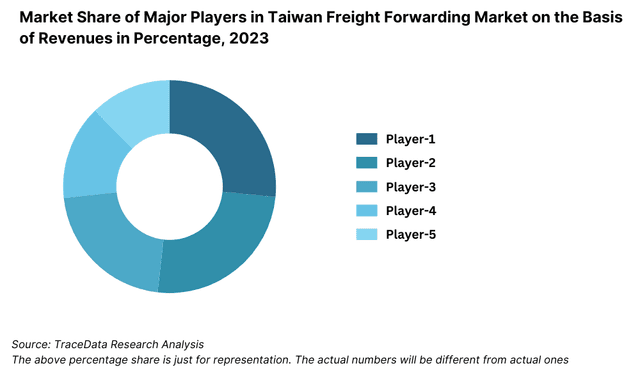
8.5.2. Market Share of Maior Players in Taiwan Freight Forwarding Market, 2023
8.5.3. Cross Comparison of Major Players in Freight Forwarding Companies on the Basis of Parameters including Volume of Road Freight, Inception Year, Number of Fleets (Owned and Subcontracted), Fleets by Type, Occupancy Rate, Number of Employees, Major Route Network, Major Clients, Revenues, Volume of Sea Freight, Volume of Air Freight, USP, Business Strategy, Technology, (2023)
8.6. Taiwan 3PL Freight Forwarding Future Market Size by Revenues, 2025-2029
8.7. Taiwan Freight Forwarding Market Segmentation, 2025-2029
8.7.1. Future Market Segmentation by Mode of Freight Transport (Road, Sea, Air and Rail), 2025-2029
8.7.2. Future Market Segmentation by International Road Freight Corridors (China, Thailand and Taiwan), 2025-2029
8.7.3. Future Market Segmentation by End User (Industrial, FMCG, F&B, Retail and Others), 2025-2029
9.1. Market Overview and Genesis
9.2. Value Chain Analysis in Taiwan Warehousing Market including entities, margins, role of each entity, process flow, challenges and other aspects
9.3. Taiwan Warehousing Market Size on the Basis of Revenues and Warehousing Space, 2018-2024P
9.4. Taiwan 3PL Warehousing Segmentation
9.4.1. Taiwan Warehousing Revenue by Business Model (Industrial/Retail, ICD/CFS and Cold Storage), 2018-2024P
9.4.2. Taiwan Warehousing By Type of Warehouse (General, Open Yard, Freezer/Chiller, Ambient and Bonded Warehouses), 2018-2024P
9.4.3. Taiwan Warehousing Revenue by End User (Industrial & Construction, FMCG, Retail, Food & Beverage and Others), 2018-2024P
9.4.4. 3PL Warehousing Space by Region, 2024P
9.5. Competitive Landscape in Taiwan 3PL Warehousing Market
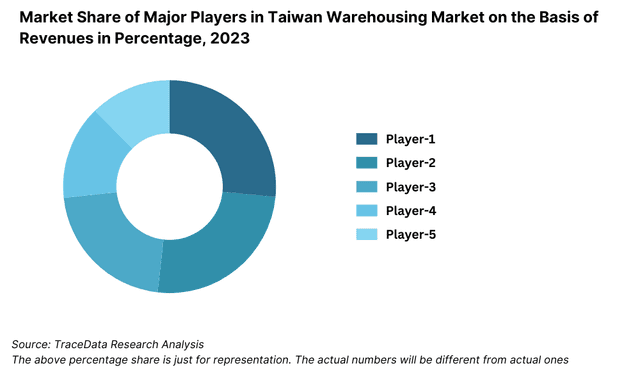
9.5.1. Market share of Top 10 Companies in Taiwan Warehousing Market, 2023
9.5.2. Cross Comparison of Top 10 3PL Warehousing Companies on the Basis of Parameters including Company Overview, USP, Business Strategy, Future Plans, Technology, Revenues from Warehousing, Number of Warehouses, Warehousing Space, Location of Warehouses, Type of Warehouses, Occupancy Rate, Rental Rates, Clients and others, (2023)
9.6. Taiwan Warehousing Future Market Size on the Basis of Revenues, 2025-2029
9.7. Taiwan Warehousing Market Future Segmentation
9.7.1. Taiwan Warehousing Revenue by Business Model (Industrial/Retail, ICD/CFS and Cold Storage), 2025-2029
9.7.2. Taiwan Warehousing Revenue By Type of Warehouse (General, Open Yard, Freezer/Chiller, Ambient and Bonded Warehouses), 2025-2029
9.7.3. Taiwan Warehousing Revenue by End User (Industrial & Construction, FMCG, Retail, Food & Beverage and Others), 2025-2029
10.1. Market Overview and Genesis
10.2. Value Chain Analysis in Taiwan CEP Market including entities, margins, role of each entity, process flow, challenges and other aspects
10.3. Revenue Composition and Contribution Between First Mile/Mid Mile and Last Mile Delivery-Analysis for Domestic and International Shipments
10.4. Taiwan CEP Market Size on the Basis of Revenues and Shipments, 2018-2024P
10.5. Taiwan CEP Market Segmentation, 2021
10.5.1. Segmentation by Mails and Documents, E-Commerce Shipments and Express Cargo, 2023-2024P
10.5.2. Segmentation by International and Domestic Express, 2023-2024P
10.5.3. Segmentation by B2B, B2C and C2C, 2023-2024P
10.5.4. Segmentation by Period of Delivery, 2023-2024P
10.6. Competitive Landscape in 3PL Market, 2021
10.6.1. Overview and Genesis, Market Nature, Market Stage and Major Competing Parameters
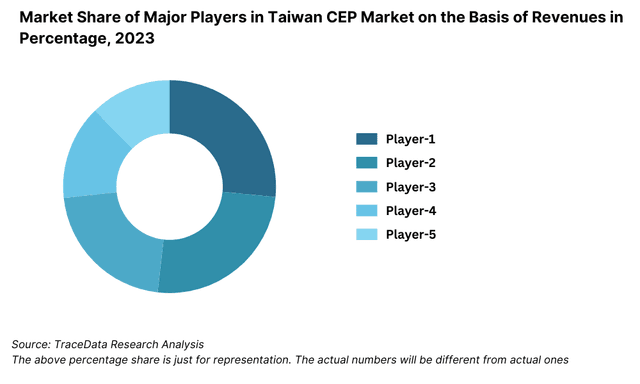
10.6.2. Market Share of Companies in Taiwan CEP Market on the Basis of Revenues/Number of Shipments, 2023
10.6.3. Market Share of Top 5 Companies in Taiwan E-Commerce Shipment Market on the Basis of Revenues/Number of Shipments, 2023
10.6.4. Cross Comparison of Top 10 Taiwan CEP Companies on the Basis of Parameters including Company Overview, USP, Business Strategy, Future Plans, Technology, Number of last Mile Delivery Shipments, Revenues, Major Clients, Number of Fleets, Number of Employees, Number of Riders, Number of Pin Code Served, Major Service Offering and others
10.7. Taiwan CEP Market Size on the Basis of Revenues and Shipments, 2025-2029
10.8. Taiwan CEP Market Segmentation
10.8.1. Segmentation by Mails and Documents, E-Commerce Shipments and Express Cargo, 2025-2029
10.8.2. Segmentation by International and Domestic Express, 2025-2029
10.8.3. Segmentation by B2B, B2C and C2C, 2025-2029
10.8.4. Segmentation by Period of Delivery, 2025-2029
11.1. Customer Cohort Analysis and End User Paradigm for Different Industry Verticals under Logistics Sector (Telecommunications, FMCG, Automotive, Apparel, F&B, Construction and Pharmaceuticals)
11.2. Understanding on Logistics Spend by End User, 2023-2024P
11.3. End User Preferences in terms of In-House or Outsourcing Logistics Services and Reason for Selection; Segregate this by Size of Company on the Basis of Revenues
11.4. Major Logistics Company who are Specialized in Serving Each Type of End User (Telecommunications, FMCG, Apparel, F&B, Construction and Pharmaceuticals)
11.5. Detailed Landscape of Each End Users across Parameters including Major Products Manufactured and Traded, Emerging Products, Type of Services Required, and Type of Services Outsourced, Major Companies, Contract Duration, Likelihood to Recommend, Market Orientation, Major Clusters, Type of Sourcing Preference, Pain Points, Facilities/Services Required, Future Outlook. Market Size for End User Industry Vertical with Growth Rate, 2018-2024P
12.1. Basis Revenues, 2025-2029
13.1. By Segment (Freight Forwarding, Warehousing, CEP and Value-Added Services), 2025-2029
13.2. By End User Industries, 2025-2029
13.3. Recommendation
13.4. Opportunity Analysis
Discuss a Customized Research Scope
Custom research scope • Tailored insights • Industry expertise
Research Methodology
Step 1: Ecosystem Creation
Map the ecosystem and identify all the demand-side and supply-side entities across the Taiwan Logistics and Warehousing Market. This includes 3PL and 4PL providers, warehousing operators, freight forwarders, cold chain specialists, industrial clients (electronics, pharma, retail), and regulatory authorities.
Based on this ecosystem, we shortlist 5–6 leading logistics and warehousing companies in Taiwan using parameters such as revenue contribution, fleet size, warehousing capacity (in sq. meters), regional coverage, and infrastructure investment.
Initial sourcing is carried out via industry publications, trade association bulletins, proprietary databases, and government logistics reports.
Step 2: Desk Research
We undertake comprehensive desk research using multiple secondary and paid databases to gather detailed insights on market structure, service offerings, pricing models, warehousing utilization rates, cargo throughput, and key performance indicators across logistics modes.
Our analysis includes review of published documents such as annual reports, press releases, company brochures, case studies, market intelligence portals, and government statistics from the Ministry of Transportation and Communications (MOTC), Customs Administration, and Industrial Development Bureau (IDB).
This research helps to build an industry-level understanding, assess competitive positioning, and identify historical trends and forward-looking market dynamics.
Step 3: Primary Research
A series of in-depth interviews are conducted with senior executives and operational heads across logistics service providers, e-commerce firms, retail chains, manufacturers, and cold chain users to validate the findings from secondary sources.
Discussions include evaluation of cost structures, utilization rates, fleet expansion plans, technology adoption, client portfolio, and regional service efficiency.
A bottom-up approach is used to estimate warehouse capacity, cargo volumes handled, and revenue contribution per player. These figures are then extrapolated to derive the overall market size.
Additionally, disguised interviews are conducted wherein our team approaches logistics companies under the pretext of prospective clients or partners. This enables validation of commercial models, pricing strategies, service levels, and investment plans without bias.
Step 4: Sanity Check
A combination of bottom-up and top-down modeling frameworks are employed to finalize market size, growth rates, and segment-wise breakdowns.
Cross-verification is conducted by benchmarking key metrics such as warehousing stock (in sq. meters), port cargo volumes (in million tons), logistics cost as a percentage of GDP, and e-commerce parcel delivery volumes with regional standards and global best practices.
See What's Inside the Report
Get a preview of key findings, methodology and report coverage
Frequently Asked Questions
The Taiwan logistics and warehousing market is expected to witness robust growth, reaching a valuation of TWD 280 Billion in 2023 and projected to grow steadily through 2029. This growth is driven by the country’s strategic location in East Asia, its strong electronics and manufacturing base, and rising demand for advanced logistics services from e-commerce and export-driven industries. Continued government investment in infrastructure and digital logistics capabilities further enhances the market’s potential.
The market is led by established players such as Kerry TJ Logistics, Dimerco Express, HCT Logistics, Evergreen Logistics, and Yamato Transport Taiwan. These companies are recognized for their integrated logistics solutions, vast warehousing infrastructure, and technological advancements. Emerging players like Chi Lin Technology are also gaining traction by offering automation and smart warehousing solutions.
Key growth drivers include the rise in e-commerce, increasing demand for cold chain and pharma logistics, adoption of smart warehousing technologies, and Taiwan’s growing relevance as a transshipment and regional logistics hub. Government policies supporting free trade zones and green logistics also play a significant role in driving growth.
The market faces several challenges, including rising operational costs, land scarcity for warehouse expansion, a shortage of skilled logistics labor, and fragmentation in supply chain coordination among smaller operators. Additionally, maintaining compliance with evolving safety and sustainability regulations requires continuous investment and adaptation from logistics providers.
License Options
PDF + Excel
Complete report package
$4,000
Excel Only
Data and analytics
$2,500
Custom Sections
Starts from $100
$0