Thailand AI Engineering Market Outlook to 2030
By Service Line, By End-User Industry, By Deployment Model, By Company Size, and By Region
Report Overview
Report Code
TDR0360
Coverage
Asia
Published
October 2025
Pages
80
Flexible Purchase Options
Select and purchase only the chapters you need for your strategic decisions
On This Page
Report Overview
The report titled “Thailand AI Engineering Market Outlook to 2030 – By Service Line, By End-User Industry, By Deployment Model, By Company Size, and By Region” provides a comprehensive analysis of the AI engineering industry in Thailand. The report covers an overview and genesis of the industry, overall market size in terms of revenue, and market segmentation. It further highlights trends and developments, the regulatory landscape, customer-level profiling, issues and challenges, and the competitive landscape including competition scenario, cross-comparison, opportunities and bottlenecks, and company profiling of major players in the AI engineering market.
Report Coverage
Verified Market Sizing
Multi-layer forecasting with historical data and 5–10 year outlook
Deep-Dive Segmentation
Cross-sectional analysis by product type, end user, application and region
Competitive Benchmarking & Positioning
Market share, operating model, pricing and competition matrices
Actionable Insights & Risk Assessment
High-growth white spaces, underserved segments, technology disruptions and demand inflection points
Review Methodology & Data Structure
Preview report structure, data sources and research framework
Executive Summary
The report titled “Thailand AI Engineering Market Outlook to 2030 – By Service Line, By End-User Industry, By Deployment Model, By Company Size, and By Region” provides a comprehensive analysis of the AI engineering industry in Thailand. The report covers an overview and genesis of the industry, overall market size in terms of revenue, and market segmentation. It further highlights trends and developments, the regulatory landscape, customer-level profiling, issues and challenges, and the competitive landscape including competition scenario, cross-comparison, opportunities and bottlenecks, and company profiling of major players in the AI engineering market. The report concludes with future market projections based on service lines, end-user industries, deployment models, regions, cause-and-effect relationships, and success case studies highlighting the major opportunities and cautions.
Thailand AI Engineering Market Overview and Size
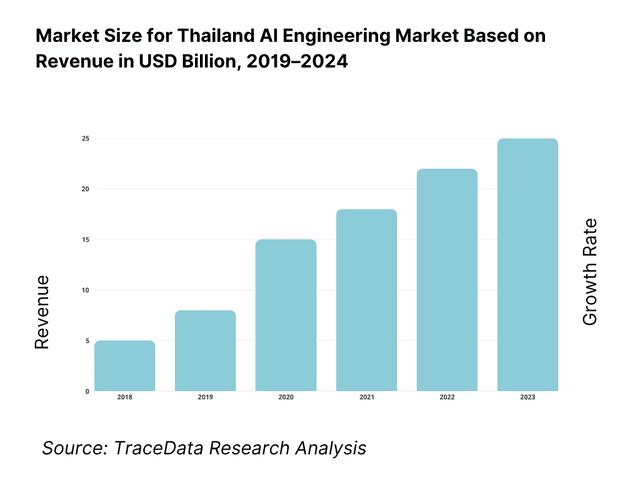
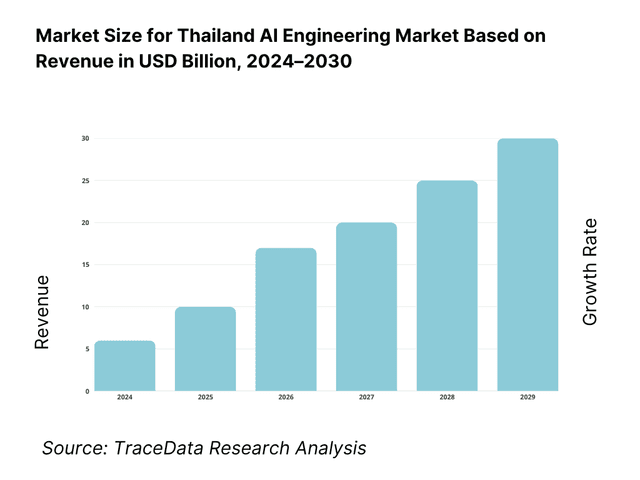
Thailand’s AI/ML market is valued at US$222.7 million, based on a five-year historical analysis of software and services spend in machine learning, the core of AI engineering. Momentum is reinforced by enterprise software expansion: THB 44.5 billion software vendor revenue was recorded in 2H, with “AI platforms” the fastest-growing stack. In parallel, policy and hyperscaler moves in Bangkok/Chonburi are expanding demand; government plans call for 50,000 AI-skilled workers, while cloud region and DC investments include US$1 billion (Google) and multi-billion expansions by other providers—catalyzing model deployment, MLOps, and data modernization at scale.
Bangkok dominates as the decision and delivery hub for banks, telcos, and retailers, concentrating AI engineering budgets, enterprise datasets, and partner ecosystems. The Eastern Economic Corridor (EEC: Chonburi–Rayong–Chachoengsao) anchors industrial AI (vision QC, predictive maintenance) and houses new hyperscale infrastructure. Recently approved data-center and cloud projects total THB 90.9 billion (US$2.7 billion), with single-project commitments such as TikTok’s THB 126.8 billion data-hosting build—drawing OEMs, SIs, and startups around compute, storage, and carrier-neutral interconnect. These assets compress latency and meet PDPA/data-residency needs, making Bangkok/EEC the preferred loci for AI engineering workloads.
What Factors are Leading to the Growth of the Thailand AI Engineering Market:
Digital transaction rails creating AI-grade data exhaust: Thailand’s real-time and electronic payment rails are at national scale, generating high-volume, high-frequency datasets that fuel AI fraud, risk, and personalization engines. There are 139.0 million internet and mobile banking accounts processing 2,681.4 million transactions in a single month, with monthly transaction value at THB 9,369.6 billion. PromptPay registrations have reached 78.5 million IDs, and e-money accounts total 118.6 million. These rails, combined with an urban population base of ~38.9 million and a total population of 71,668,011, create continuous demand for AI engineering in fraud analytics, AML, credit scoring, and omnichannel personalization.
Connectivity footprint and data gravity for model deployment: Nationwide connectivity provides the substrate for AI applications and pipelines. Thailand has 120,921,000 mobile cellular subscriptions and 15.75 fixed-broadband lines per 100 people. On the supply side, power and edge locations are scaling: EGAT’s net peak demand reached 36,477.80 MW, with purchases from independent producers at 19,598.50 MW, small producers at 9,319.88 MW, and imports at 6,234.90 MW. This reliable energy and connectivity backbone ensures data-center uptime and AI inference at scale. Combined, demand-side digital activity and supply-side infrastructure create strong “data gravity,” justifying robust AI engineering investments.
Investment climate for data centers and cloud localization: Regulatory-supported foreign and domestic investment is driving local compute in Bangkok and the Eastern Economic Corridor, reducing latency and enabling data residency. Approved government projects for data centers and cloud services total THB 90.9 billion, with examples including a 300-MW facility valued at THB 72.7 billion and a 35-MW site worth THB 13.5 billion. Separately, a single hyperscale data-hosting project valued at THB 126.8 billion demonstrates long-term confidence in Thailand’s AI infrastructure. These concrete investments lower barriers for enterprises to productionize models with local MLOps, observability, and PDPA-aligned storage.
Which Industry Challenges Have Impacted the Growth of the Thailand AI Engineering Market:
Aging demographics and skilled-talent bottlenecks: AI engineering scale-up depends on specialist data and ML talent, but Thailand’s demographic profile is tightening labor supply. The country’s population is 71,668,011, with 11,010,180 people aged 65+, creating a growing senior cohort that reduces the available workforce. With ~38.9 million people in urban areas driving digital demand, the regional supply of AI engineers becomes thinner. This imbalance intensifies competition for MLOps, platform, and site-reliability profiles, lengthening hiring cycles and pushing firms toward managed services rather than fully in-house AI engineering capacity.
Power and infrastructure headroom for AI compute: Sustained AI workloads require grid reliability and power density. EGAT recorded net peak demand of 36,477.80 MW and maintains significant purchased capacity from independent producers (19,598.50 MW), small producers (9,319.88 MW), and cross-border imports (6,234.90 MW). While capacity is strong, GPU clusters, water-cooled racks, and distributed edge compute nodes compete with industrial and residential loads. This creates site-selection constraints and requires meticulous energy planning for Tier III/IV data centers hosting model training and inference, challenging operators to balance industrial demand with AI growth.
Data-protection enforcement and remediation workload: Enforcement of data-protection regulations has increased remediation workloads for AI engineering teams. Since implementation, regulators have received over 390 complaints and more than 380 breach notifications, with the first administrative fine totaling THB 7,000,000. Enterprises must now allocate engineering time to consent orchestration, data-subject rights automation, and retention/de-identification workflows. These functions are essential for compliant AI but slow down innovation when legacy data estates lack proper metadata and lineage, delaying model deployment and feature velocity.
What are the Regulations and Initiatives which have Governed the Market:
Personal Data Protection Act (PDPA) — enforcement actions and time-bound obligations: Thailand’s PDPA is fully active, with enforcement already in effect. Regulators have received more than 390 complaints and over 380 breach notifications, and the first fine imposed reached THB 7,000,000. Controllers are now required to delete, destroy, or de-identify personal data within 90 days. This shapes AI engineering practices in data retention, anonymization, lineage tracking, and feature-store design, making compliance a central part of engineering workflows.
Cybersecurity Act B.E. 2562 (2019) — CII designation and oversight: The Cybersecurity Act empowers the National Cyber Security Committee to classify Critical Information Infrastructure across eight priority sectors, including banking/finance, IT-telecom, energy, and public health. Entities in these sectors must comply with incident-response, audit, and monitoring obligations, which directly affect AI platforms and model-serving endpoints. Vendors are required to design for secure segregation, backup, and compliance reporting—conditions that shape licensing decisions for MLOps and observability tools across regulated industries.
BOI promotion for data centers and cloud services — investment approvals and capacity: Thailand’s investment authority actively promotes digital infrastructure, approving projects totaling THB 90.9 billion for data centers and cloud services. Facilities include a 300-MW site worth THB 72.7 billion and a 35-MW site valued at THB 13.5 billion. These approvals enable providers to secure the necessary permits and utility contracts to host GPU-dense AI deployments while aligning with PDPA’s data-localization requirements. For AI engineers, this investment framework determines feasible availability zones for model hosting, licensing, and interconnect infrastructure.
Thailand AI Engineering Market Segmentation
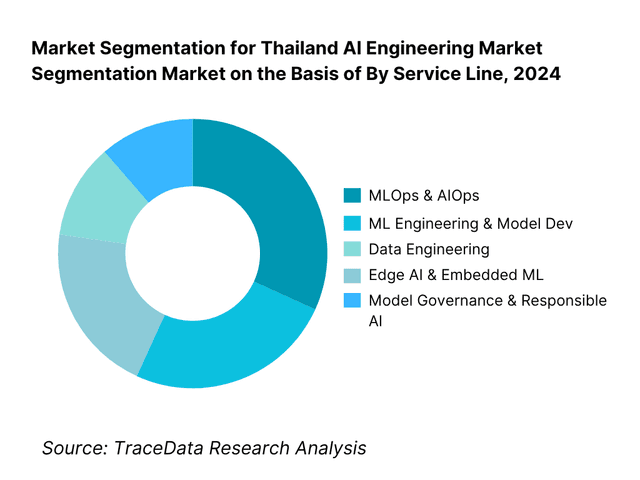
By Service Line: Thailand AI engineering demand tilts toward MLOps & AIOps, which recently holds the largest share as enterprises shift from proofs-of-concept to productionized AI. The need to orchestrate pipelines, manage feature stores, ensure reproducible training, and monitor drift has elevated platform engineering over algorithm novelty. Banks and insurers require lineage, access controls, and model risk sign-offs to align with PDPA and sector rules (BOT/OIC), while retailers and manufacturers emphasize observability and autoscaling to match seasonal peaks and factory takt times. Together, these constraints push budgets toward deployment tooling, CI/CD for models, and runtime SLOs—firmly positioning MLOps as the center of gravity for Thai AI engineering.
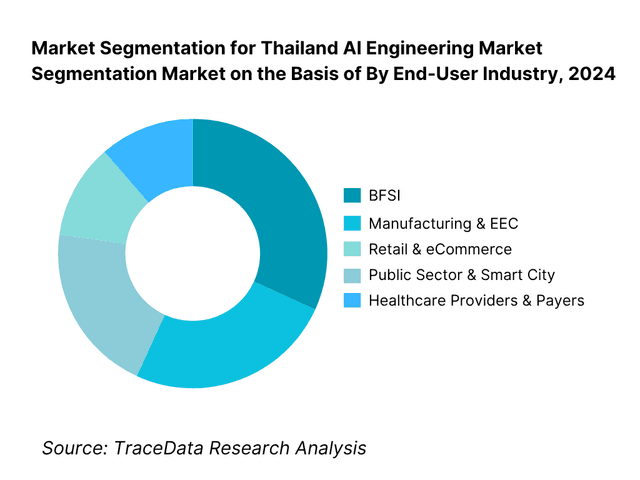
By End-User Industry: BFSI leads Thai AI engineering uptake because it concentrates high-value, high-volume data and faces stringent compliance, driving sustained spend on KYC/AML, fraud detection, credit scoring, and conversational agents. Incumbent banks’ cloud programs and digital arms (e.g., KBTG) funnel budget to robust data fabrics, vector databases for RAG, and continuous validation to satisfy model-risk reviews. The economics of reduced loss ratios and improved collections make AI initiatives self-funding, while BOT’s supervisory posture and PDPA requirements incentivize auditable pipelines, access governance, and encryption—further deepening BFSI’s reliance on specialist AI engineering capability.
Competitive Landscape in Thailand AI Engineering Market
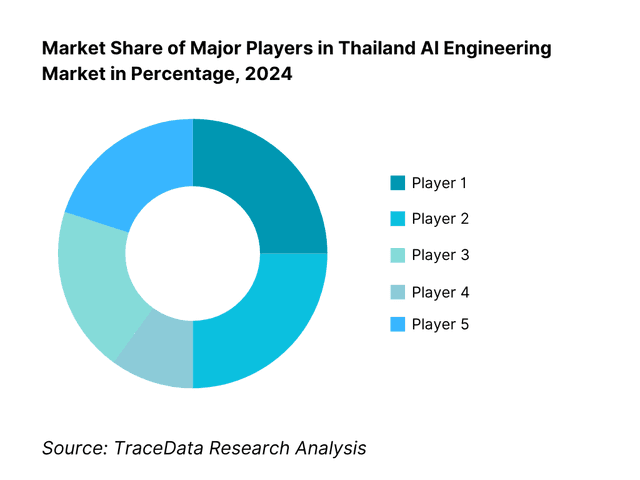
The Thailand AI engineering market coalesces around a mixed field of local solution specialists and global cloud/platform leaders. Locals (e.g., Sertis, G-Able, MFEC) win regulated and Thai-language workloads through contextual data assets, delivery proximity, and PDPA-ready architectures. Global platforms (Microsoft, Google Cloud, AWS) catalyze the stack with model gardens and managed MLOps, while telco-adjacent players and bank digital arms (True Digital, KBTG) anchor domainized solutions. This hybrid structure—local services + global platforms—concentrates influence in a dozen firms with privileged access to compute, data, and alliances, setting a high bar for new entrants.
Name | Founding Year | Original Headquarters |
Sertis | 2014 | Bangkok, Thailand |
Amity Solutions | 2012 | Bangkok, Thailand |
Data Wow | 2016 | Bangkok, Thailand |
ARV (AI & Robotics Ventures) | 2018 | Bangkok, Thailand |
G-Able | 1989 | Bangkok, Thailand |
MFEC Public Company | 1997 | Bangkok, Thailand |
True Digital Group | 2018 | Bangkok, Thailand |
KBTG | 2016 | Bangkok, Thailand |
AppMan | 2011 | Bangkok, Thailand |
Wisesight | 2007 | Bangkok, Thailand |
AIYA | 2019 | Bangkok, Thailand |
Zwiz.ai | 2017 | Bangkok, Thailand |
VISAI | 2020 | Bangkok, Thailand |
Adastra (Thailand) | 2000 | Toronto, Canada |
DBot | 2021 | Bangkok, Thailand |
Some of the Recent Competitor Trends and Key Information About Competitors Include:
Sertis: As one of Thailand’s leading AI solution providers, Sertis expanded its retail and energy AI offerings in 2024, with new computer vision platforms for demand forecasting and inventory optimization. The company also deepened its focus on Thai-language NLP to improve chatbots and customer interaction tools for domestic clients.
Amity Solutions: Known for its enterprise communication and AI engagement platforms, Amity Solutions enhanced its conversational AI stack in 2024 by integrating with global cloud providers, enabling faster deployment of multilingual AI assistants for banking and telecom clients.
ARV (AI & Robotics Ventures): Specializing in industrial AI and robotics, ARV launched new predictive maintenance solutions in 2024 for oil & gas and manufacturing firms within the Eastern Economic Corridor. These edge AI deployments highlight ARV’s commitment to Industry 4.0 transformation in Thailand.
G-Able: A long-established Thai IT integrator, G-Able strengthened its AI engineering practice in 2024 by focusing on MLOps services and PDPA-compliant model governance frameworks. The company also collaborated with major hyperscalers to accelerate AI adoption in BFSI and public-sector institutions.
True Digital Group: Backed by the True Corporation, True Digital Group rolled out expanded AI-driven personalization services for its telecom and retail platforms in 2024. The firm also invested in edge AI capabilities within its 5G and MEC infrastructure to enable real-time analytics for enterprise clients.
What Lies Ahead for Thailand AI Engineering Market?
The Thailand AI Engineering market is set to advance steadily through the next decade, supported by hyperscale cloud investments, government policy backing, and enterprise digitalization. Demand will be underpinned by national data-center projects worth THB 90.9 billion approved for Bangkok and the Eastern Economic Corridor, together with BOI-endorsed investment incentives. The parallel push for AI workforce development, targeting 50,000 professionals by national strategy, reinforces delivery capacity. This momentum ensures sustained opportunities for MLOps, governance, Thai-language NLP, and sector-specific deployments in BFSI, manufacturing, retail, and public services.
Rise of Hybrid AI Deployments: The future of AI engineering in Thailand is moving toward hybrid models, where enterprises blend public cloud services with edge and private deployments. Latency-sensitive use cases in manufacturing hubs and regulated workloads in BFSI necessitate hybrid setups. With electricity demand already peaking at 36,477.80 MW and distributed IPP/SPP contributions exceeding 28,900 MW, the infrastructure backbone supports scale-out of edge nodes and MEC platforms, making hybrid AI the dominant architecture.
Focus on Outcome-Based AI Solutions: Enterprises are shifting budgets toward solutions that directly link model deployment to measurable business KPIs. Banking and payment rails generate 2,681.4 million monthly digital transactions, while PromptPay IDs exceed 78.5 million, creating ample grounds for fraud analytics and KYC automation. AI engineering teams are therefore under pressure to deliver models with quantifiable lift in fraud detection, customer onboarding, and churn reduction, rather than experimental pilots, making outcome-based AI the expected norm.
Expansion of Sector-Specific AI Engineering: Industry-tailored AI engineering will intensify, especially across BFSI, EEC manufacturing, and public health. The Eastern Economic Corridor, home to petrochemical and industrial clusters, benefits from power imports of 6,234.90 MW and IPP supplies above 19,598.50 MW, enabling compute-intensive vision QC and predictive maintenance. In BFSI, BOT mandates for AML/KYC and the 139 million mobile/internet banking accounts form a natural locus for AI fraud and risk engines. Sector-specific architectures, pretrained embeddings, and domain benchmarks will increasingly dominate vendor playbooks.
Leveraging Generative AI and Analytics for Personalization: Generative AI adoption in Thailand is expected to deepen, with BFSI, retail, and telecoms using Thai-language LLMs for copilots, chatbots, and recommendation systems. Monthly transaction volumes exceeding THB 9,369.6 billion on digital payment rails create abundant supervised datasets for model fine-tuning. In parallel, edge AI deployments in EEC plants and True Digital’s MEC backbone will enable multimodal analytics, aligning with PDPA obligations for anonymization and compliance. As a result, AI engineering will become more data-driven, personalized, and regulation-aware, improving ROI and governance simultaneously.
Thailand AI Engineering Market Segmentation
By Service Line
Data Engineering & Feature Engineering
Machine Learning / Model Development
MLOps & AIOps
Model Governance & Responsible AI
Edge AI & Embedded ML
By End-User Industry
BFSI (Banking, Insurance, Capital Markets)
Manufacturing & Eastern Economic Corridor (EEC) Industries
Retail & eCommerce
Healthcare & Life Sciences
Public Sector & Smart Cities
By Deployment Model
Public Cloud (AWS, Azure, Google Cloud Thailand region)
Hybrid / Multi-Cloud
Private Cloud & On-Premise Data Centers
Edge AI & MEC (Mobile Edge Computing)
On-Device AI
By Company Size / Buyer Segment
Large Enterprises
Upper Mid-Market Firms
Mid-Market Enterprises
SMEs
Digital-Native Startups
By AI Model Class / Application Type
Natural Language Processing (Thai-language LLMs, chatbots, copilots)
Computer Vision (manufacturing QC, retail analytics, surveillance)
Time-Series / Forecasting (finance, energy, logistics)
Recommenders & Personalization Engines
Multimodal AI & Agentic Systems
Players Mentioned in the Report:
Sertis
Amity Solutions
Data Wow
ARV (AI & Robotics Ventures)
G-Able
MFEC Public Company
True Digital Group
KBTG (Kasikorn Business-Technology Group)
AppMan
Wisesight
AIYA
Zwiz.ai
VISAI
Adastra (Thailand)
DBot.
Key Target Audience
Chief Information/Technology/Data Officers (large banks, insurers, retailers, manufacturers)
Heads of Risk/Model Risk Management (BFSI)
Operations & Plant Directors (EEC manufacturing clusters)
Public-sector digital leaders (Digital Government Development Agency, Ministry of Digital Economy and Society — MDES)
Regulated-sector compliance leaders (Bank of Thailand — BOT; Securities and Exchange Commission — SEC; Office of Insurance Commission — OIC)
Procurement & Vendor-Management Heads (enterprise and SOE)
Investments and venture capitalist firms (CVC/VC funds backing AI infra and SaaS)
Government & regulatory bodies
Time Period:
Historical Period: 2019-2024
Base Year: 2025
Forecast Period: 2025-2030
Explore Flexible Purchase Options or Have Limited Budget?
Pay only for relevant chapters • Customizable report sections
Table of Contents
Choose individual sections to purchase. Mix and match as you like.
4.1. Delivery Model Analysis for AI Engineering (Cloud-native, Edge AI, Hybrid AI, On-prem AI, Managed Services)-Margins, Preference, Strengths, Weaknesses
4.2. Revenue Streams in Thailand AI Engineering Market (Project-based, Subscription, Token-based, Outcome-linked, Managed Service)
4.3. Business Model Canvas for Thailand AI Engineering Market
5.1. Local Startups vs Global Players (Thailand-based AI solution providers vs international platforms)
5.2. Investment Model in Thailand AI Engineering Market (VC, CVC, Sovereign Funds, BOI Incentives)
5.3. Comparative Analysis of AI Deployment by Private & Government Organizations (Cloud adoption, Data Residency, Model Governance)
5.4. AI Budget Allocation by Company Size
8.1. Revenues (Historical Performance)
9.1. By Market Structure (In-house AI teams vs Outsourced AI Engineering)
9.2. By Service Line (Data Engineering, ML Engineering, MLOps, Model Governance, Edge AI)
9.3. By Industry Verticals (BFSI, IT/Telecom, Manufacturing & EEC, Healthcare, Retail & eCommerce, Public Sector)
9.4. By Company Size (Large Enterprises, Mid-market, SMEs, Digital-Native Firms)
9.5. By Buyer Persona (CIOs, CTOs, Chief Data Officers, Innovation Heads)
9.6. By Mode of Deployment (Public Cloud, Hybrid Cloud, Private Cloud, Edge AI)
9.7. By Commercial Model (Project-based, Subscription, Consumption-based, IP Licensing)
9.8. By Region (Bangkok & Central, Northern Thailand, Eastern Economic Corridor, Southern Thailand)
10.1. Enterprise Buyer Landscape & Cohort Analysis
10.2. AI Adoption Needs & Decision-Making Process
10.3. ROI Analysis of AI Engineering Programs
10.4. Gap Analysis Framework
11.1. Trends and Developments (Thai LLMs, Generative AI adoption, AI ethics frameworks, Edge AI for factories)
11.2. Growth Drivers (Cloud region launches, Government AI strategy, Enterprise digitalization, Smart cities)
11.3. SWOT Analysis for Thailand AI Engineering Market
11.4. Issues & Challenges (Talent shortage, GPU scarcity, Data localization)
11.5. Government Regulations (PDPA, BOT AI guidelines, Cybersecurity Act, Cloud First Policy)
12.1. Market Size & Future Potential for Cloud/Online AI Engineering Services
12.2. Business Models & Revenue Streams of AI-as-a-Service Providers
12.3. Deployment Models & Type of AI Services Offered
15.1. Market Share of Key Players (Basis Revenues & Client Wins)
15.2. Benchmark of Key Competitors (Company Overview, USP, Business Strategy, Operating Model, Revenue Streams, Pricing, Number of AI Engineers, Technology Stack, Best-selling Solutions, Client Portfolio, Strategic Alliances, Recent Developments)
15.3. Operating Model Analysis Framework
15.4. Gartner Magic Quadrant (Adapted for AI Engineering Vendors)
15.5. Bowman’s Strategic Clock for Competitive Advantage
16.1. Revenues (Future Projections)
17.1. By Market Structure (In-house vs Outsourced AI Engineering)
17.2. By Service Line (Data Engineering, ML Engineering, MLOps, Model Governance, Edge AI)
17.3. By Industry Verticals (BFSI, IT/Telecom, Manufacturing, Healthcare, Retail, Public Sector)
17.4. By Company Size (Large Enterprises, Mid-market, SMEs)
17.5. By Buyer Persona (CIOs, CTOs, CDOs, Innovation Heads)
17.6. By Mode of Deployment (Cloud, Hybrid, Edge, Private)
17.7. By Commercial Model (Project-based, Subscription, IP Licensing)
17.8. By Region (Bangkok & Central, Northern, EEC, Southern)
Discuss a Customized Research Scope
Custom research scope • Tailored insights • Industry expertise
Research Methodology
Step 1: Ecosystem Creation
Map the Thailand AI Engineering ecosystem across demand and supply. Demand-side: BFSI (banks, insurers), retail & eCommerce platforms, manufacturing clusters in the EEC, healthcare providers/payers, telecoms, and public-sector digital programs. Supply-side: hyperscalers (cloud regions/providers), systems integrators, specialist AI startups, telcos/MEC operators, data-center & colocation providers, labeling/data vendors, and cybersecurity/GRC toolchains. From this map, shortlist 5–6 leading providers (e.g., Sertis, G-Able, MFEC, ARV, KBTG, True Digital) using disclosed financials, client references in regulated sectors, Thai-language/NLP depth, certifications, and delivery scale.
Step 2: Desk Research
Conduct exhaustive desk research using a blend of public and proprietary sources to build an industry baseline. Aggregate company disclosures, press releases, audited statements, registry filings, regulator notices, cloud partner directories, and tender portals. Extract signals on service-line mix (data/ML engineering, MLOps, governance, edge), client logos by sector, delivery capacity, partnerships, certifications, hiring velocity, and IP. Collate commercial models (project, managed, consumption, IP licensing), engagement constructs (POC→scale), and procurement patterns (RFP criteria, SLAs). Create a harmonized ledger of provider-level metrics for cross-comparison.
Step 3: Primary Research
Run structured interviews with C-suite and functional leaders on both the buy- and sell-sides: CIO/CTO/CDO, Heads of Model Risk/Compliance (BFSI), Manufacturing Ops leads (EEC), Public-sector digital chiefs, and vendor delivery heads. Objectives: validate hypotheses, reconcile service-line revenue contributions, clarify pricing envelopes and SOW scopes, and map time-to-production, governance gates, and model risk workflows. Use disguised buyer interviews (where appropriate) to triangulate pipeline quality, win/loss reasons, utilization, GPU access modes, and referenceability. Build bottom-up revenue rolls per provider and reconcile with desk-research evidence.
Step 4: Sanity Check
Execute top-down ↔ bottom-up reconciliation and scenario stress tests. Normalize for scope differences (platform vs services, one-off vs recurring), remove double counts across consortium deals, and apply outlier pruning where ratios (e.g., headcount vs billed hours, project count vs utilization) breach realistic bands. Run sensitivity analyses on key drivers (regulated-sector exposure, cloud attach, edge share) and document an audit trail: sources used, assumptions taken, and adjustments made. Lock the final model only after peer review and re-verification with a subset of interviewees.
See What's Inside the Report
Get a preview of key findings, methodology and report coverage
Frequently Asked Questions
The Thailand AI Engineering Market is positioned for significant advancement, with the national AI/ML market valued at US$222.7 million in 2023. Growth potential is anchored by hyperscaler data-center investments worth THB 90.9 billion, alongside government initiatives to train 50,000 AI professionals under the National AI Strategy. The combination of enterprise digital transformation, robust BFSI and manufacturing use cases, and expanding cloud regions in Bangkok and the Eastern Economic Corridor ensures a strong platform for future market expansion.
The Thailand AI Engineering Market features a diverse mix of local providers and global alliances. Key domestic players include Sertis, Amity Solutions, Data Wow, ARV (AI & Robotics Ventures), G-Able, MFEC, True Digital Group, and KBTG. These companies dominate through Thai-language NLP expertise, partnerships with hyperscalers, and strong delivery capacity across regulated sectors like BFSI, healthcare, and manufacturing. Other notable players include AppMan, Wisesight, AIYA, Zwiz.ai, VISAI, Adastra (Thailand), and DBot, which enhance the ecosystem with vertical-specific AI services and solutions.
Primary drivers include Thailand’s 2,681.4 million monthly digital banking transactions and 78.5 million PromptPay IDs, which provide massive datasets for AI risk and personalization engines. The Eastern Economic Corridor (EEC) also anchors growth with industrial demand supported by 36,477.80 MW peak electricity capacity, facilitating AI-enabled manufacturing and predictive maintenance. In addition, government-approved THB 126.8 billion data-hosting investments from global platforms highlight sustained infrastructure localization, reducing latency and strengthening data residency compliance under PDPA—factors that strongly accelerate AI engineering adoption.
The Thailand AI Engineering Market faces three significant challenges. First, talent shortages amid an aging population of 11 million aged 65+ strain the supply of AI engineers and data scientists. Second, infrastructure constraints emerge as GPU-dense data centers compete with grid demand already at 36,477.80 MW peak load, requiring careful site planning. Finally, regulatory compliance under PDPA is intensifying, with over 390 complaints and fines of THB 7 million, forcing firms to divert engineering resources into anonymization, lineage, and audit functions that can slow innovation velocity.
License Options
PDF + Excel
Complete report package
$4,000
Excel Only
Data and analytics
$2,500
Custom Sections
Starts from $100
$0