Thailand Automotive Manufacturing Market Outlook to 2030
By Vehicle Type, By Propulsion, By Assembly Mode, By Component Value-Add, By Export Region, and By Manufacturing Cluster
Report Overview
Report Code
TDR0361
Coverage
Asia
Published
October 2025
Pages
80
Flexible Purchase Options
Select and purchase only the chapters you need for your strategic decisions
On This Page
Report Overview
The report titled “Thailand Automotive Manufacturing Market Outlook to 2030 – By Vehicle Type, By Propulsion, By Assembly Mode, By Component Value-Add, By Export Region, and By Manufacturing Cluster” provides a comprehensive analysis of the automotive manufacturing industry in Thailand. The report covers an overview and genesis of the industry, overall market size in terms of revenue and output, market segmentation; trends and developments, regulatory landscape, customer level profiling, issues and challenges, and competitive landscape including competition scenario, cross-comparison, opportunities and bottlenecks, and company profiling of major players in the automotive manufacturing market.
Report Coverage
Verified Market Sizing
Multi-layer forecasting with historical data and 5–10 year outlook
Deep-Dive Segmentation
Cross-sectional analysis by product type, end user, application and region
Competitive Benchmarking & Positioning
Market share, operating model, pricing and competition matrices
Actionable Insights & Risk Assessment
High-growth white spaces, underserved segments, technology disruptions and demand inflection points
Review Methodology & Data Structure
Preview report structure, data sources and research framework
Executive Summary
The report titled “Thailand Automotive Manufacturing Market Outlook to 2030 – By Vehicle Type, By Propulsion, By Assembly Mode, By Component Value-Add, By Export Region, and By Manufacturing Cluster” provides a comprehensive analysis of the automotive manufacturing industry in Thailand. The report covers an overview and genesis of the industry, overall market size in terms of revenue and output, market segmentation; trends and developments, regulatory landscape, customer level profiling, issues and challenges, and competitive landscape including competition scenario, cross-comparison, opportunities and bottlenecks, and company profiling of major players in the automotive manufacturing market. The report concludes with future market projections based on vehicle volumes, propulsion mix, assembly structures, export regions, cause-and-effect relationships, and success case studies highlighting the major opportunities and cautions.
Thailand Automotive Manufacturing Market Overview and Size
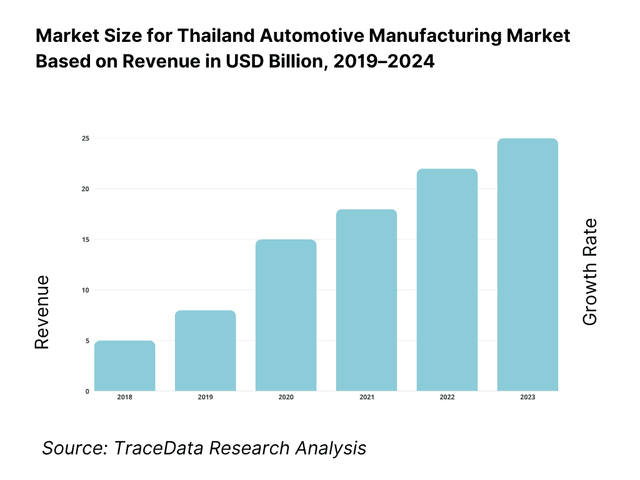
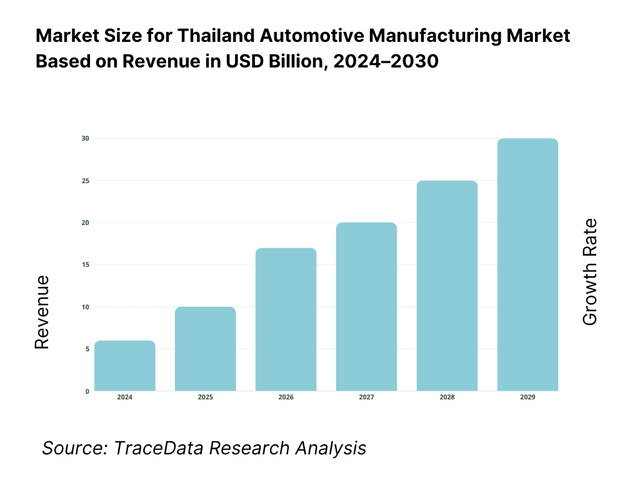
Thailand’s automotive manufacturing industry is valued at USD 53 billion, based on a five-year historical analysis of sector turnover. Output totals 1,841,663 vehicles with car export value of USD 19,950 million, underpinned by a deep supplier base and export-oriented pickup platforms. In the current cycle, assembly stands at 1,468,997 units and vehicle exports are valued at THB 699,000 million, reflecting tight credit at home and resilient export lanes. These figures are anchored in official OICA, Thailand Automotive Institute (TAI) and FTI-reported statistics.
Manufacturing is concentrated in the Eastern Economic Corridor (Rayong–Chonburi–Chachoengsao) and Greater Bangkok (Samut Prakan, Prachinburi) due to BOI incentives, world-class vendor parks, and proximity to Laem Chabang port. Global OEMs and Tier-1s cluster here to access export logistics, skilled labor, testing, and localized body-on-frame pickup ecosystems. Export lanes are led by Asia, Oceania and the Middle East, aligning with Thailand’s strength in pickups and PPVs and the readiness of these markets to absorb Thai-built models.
What Factors are Leading to the Growth of the Thailand Automotive Manufacturing Market:
Export-anchored production base supported by large trade flows and port capacity: Thailand’s automotive manufacturing depends on strong trade corridors that handle both vehicles and parts. National output totaled THB 19,022.2 billion at current prices, providing the industrial base for energy, steel, and plastics used by the sector. Merchandise exports reached USD 197,192.8 million in the first eight months of the year, while Laem Chabang port, the country’s primary auto gateway, processed 9.46 million TEU in the fiscal year. This combination ensures reliable export capacity for CBU, KD kits, and parts, directly sustaining assembly utilization and supplier shipments across the Eastern Economic Corridor.
Investment and FDI pipelines reinforce model allocations and localization: Model allocations in Thailand follow long-term investment signals supported by continuous foreign direct investment inflows. These inflows, consistently measured in multi-billion USD annually, finance tooling upgrades, vendor-park infrastructure, and new EV pack assembly lines. The government’s EV3.5 framework, spanning four years, ties fiscal incentives to local production and export readiness, creating predictable conditions for global OEMs. This ensures Rayong–Chonburi clusters remain competitive when headquarters assign new platforms, especially for pickups, PPVs, and xEV models. Such commitments allow suppliers to invest in e-axle, inverter, and module capabilities that extend Thailand’s manufacturing edge.
Macro demand rails for transport and manufacturing activity: Even when individual model cycles soften, macroeconomic throughput sustains the sector. Monthly exports have topped USD 26.0 billion, ensuring shipping lanes that accommodate autos and components alongside other goods. National accounts show GDP above THB 19 trillion, supporting the energy, steel, polymer, and logistics ecosystems that automotive plants rely on. This scale allows suppliers to amortize high-cost tooling across multiple platforms and stabilize takt times. The result is consistent output of pickups, SUVs, and passenger cars for ASEAN, Oceania, and Middle Eastern markets, reinforcing Thailand’s role as an export-led manufacturing base.
Which Industry Challenges Have Impacted the Growth of the Thailand Automotive Manufacturing Market:
Household leverage constrains domestic auto demand and plant scheduling: Domestic demand is pressured by high household debt, which reached THB 16.42 trillion at the end of the fourth quarter. This debt burden restricts loan approvals for vehicle purchases, delaying replacement cycles and reducing showroom throughput. As a result, OEMs often adjust shift patterns, reduce overtime, and lean more heavily on export allocations to keep lines running efficiently. While Thailand’s plants are export-oriented, weak household consumption creates volatility for models aimed at the domestic retail market, particularly sedans and small SUVs, impacting production schedules and supply-chain planning.
Electronics and IC import dependence exposes the sector to external shocks: Automotive manufacturing in Thailand relies heavily on imported integrated circuits, sensors, and electronic modules. The import bill totaled USD 203,543.8 million over the first eight months of the year, with electronics ranking among the top import categories. This dependence means chip shortages, shipping delays, or currency volatility can disrupt production lines, causing rework, idle time, or increased inventory buffers. For both ICE and xEV platforms, this vulnerability has become a critical risk factor, as localized alternatives remain limited. OEMs and Tier-1 suppliers must manage procurement risks while maintaining production commitments.
External demand variability requires buffer in export-led model: As autos are Thailand’s marquee export, fluctuations in global demand directly affect plant utilization. Bank of Thailand analyses have highlighted headwinds for auto and parts exports as global trade regained momentum unevenly. Monthly export receipts can vary by several billion USD, forcing OEMs to adjust production timetables and yard management practices. Finished vehicles awaiting shipping slots can accumulate at Laem Chabang, increasing yard dwell times and demurrage costs. Plants must align tightly with vessel schedules to avoid bottlenecks, while export variability requires strong scenario planning and risk management by manufacturers.
What are the Regulations and Initiatives which have Governed the Market:
BOI EV3.5 production-linked incentives: The EV3.5 framework, administered by the Board of Investment, is a four-year scheme that conditions fiscal incentives and subsidies on local BEV production, battery module assembly, and component sourcing. OEMs and Tier-1 suppliers must file applications and commit capacity within this window to qualify. Licensing teams must align with eligibility rules and meet milestone targets before commissioning new model lines or scaling up exports. This framework offers visibility and ensures Thailand’s role as a regional hub for EV and hybrid production.
Port Authority throughput and terminal access for vehicle logistics: Export flows rely on the Port Authority of Thailand’s capacity and regulatory oversight at Laem Chabang. The port processed 9.46 million TEU in the fiscal year, a figure that reflects the handling of both containerized KD parts and Ro-Ro vehicles. Manufacturers must comply with licensing and scheduling rules for berth windows, stevedoring, and yard management to align with export timetables. These frameworks affect lead times for pre-delivery inspection, customs clearance, and logistics synchronization, directly influencing export competitiveness and delivery reliability.
National accounts and macro baselines for investment approval: New project justifications, including EV plants, tooling upgrades, and vendor-park utilities, must reference official macroeconomic baselines. The NESDC’s national accounts reported GDP at THB 19,022.2 billion at current prices, serving as a benchmark in BOI filings, environmental assessments, and public-utility allocation planning. Agencies rely on these figures to assess feasibility, align industrial policy, and manage infrastructure readiness. This ensures that capacity expansion and supply-chain integration are grounded in official economic baselines, providing predictability for both investors and policymakers.
Thailand Automotive Manufacturing Market Segmentation
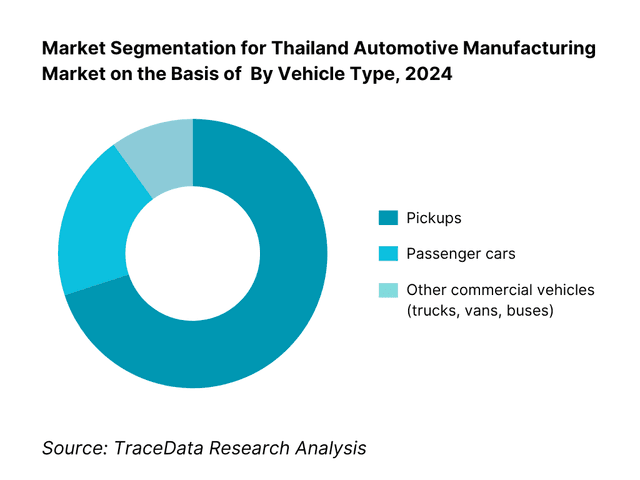
By Vehicle Type: Thailand Automotive Manufacturing market is segmented by vehicle type into passenger cars, pickups, and other commercial vehicles. Recently, pickups have a dominant market share in Thailand under the segmentation by vehicle type, due to an export-anchored ladder-frame ecosystem and long-running platform leadership in one-ton trucks. Models assembled for Asia–Oceania–Middle East routes, coupled with mature local stamping, frames, and driveline suppliers, sustain model allocations and line utilization. Passenger cars remain substantial, supported by Japanese OEM compacts and crossovers; buses and trucks are a small but strategic niche.
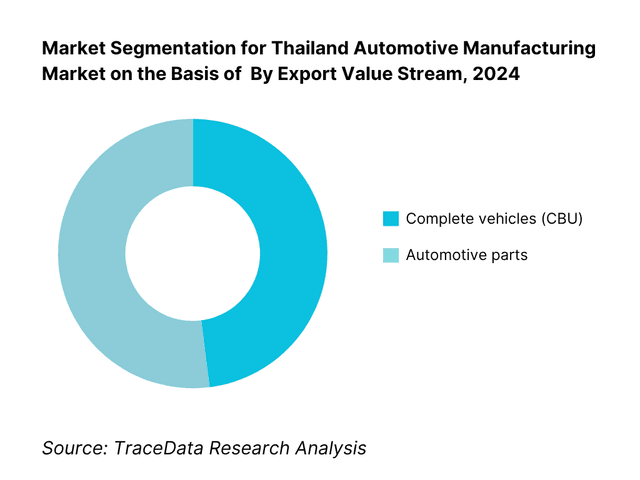
By Export Value Stream: Thailand Automotive Manufacturing market is segmented by export value stream into complete vehicles (CBU) and automotive parts. Recently, complete vehicles have a dominant share under this segmentation because Thailand has long been an export hub for finished pickups/PPVs with high unit values, robust homologation pathways, and priority access to Ro-Ro capacity. Parts remain a sizable pillar—electricals, body, and powertrain modules—leveraging a broad Tier-1/2 base; however, value density and policy emphasis keep finished vehicles in the lead.
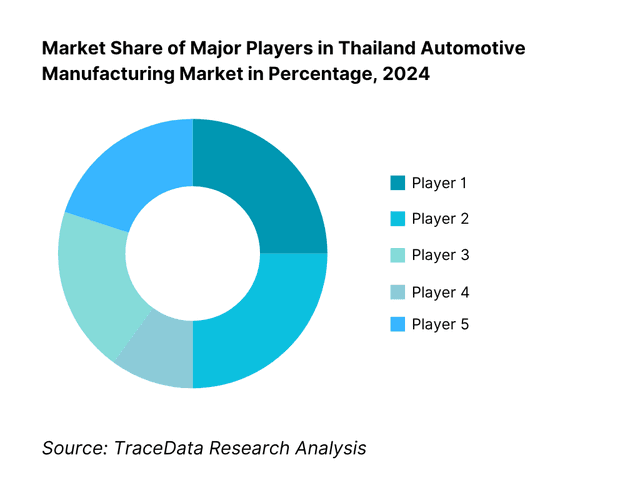
Competitive Landscape in Thailand Automotive Manufacturing Market
The Thailand Automotive Manufacturing market is characterized by entrenched Japanese OEMs alongside fast-ramping Chinese EV entrants and established export JVs. Production is consolidated around a handful of large platforms—Hilux, D-MAX, Ranger/Everest, Triton/ Pajero Sport—supplemented by localized engines, e-axles, and modules. Recent investments in BEV assembly and battery lines (e.g., BYD) signal diversification, though ICE pickups still anchor throughput. This consolidation underscores the influence of a dozen-plus OEMs and their Tier-1 ecosystems.
Name | Founding Year | Original Headquarters |
Toyota Motor Thailand | 1962 | Toyota City, Japan |
Isuzu Motors Thailand | 1966 | Tokyo, Japan |
Honda Automobile (Thailand) | 1983 | Tokyo, Japan |
Mitsubishi Motors (Thailand) | 1987 | Tokyo, Japan |
Nissan Motor Thailand | 1952 | Yokohama, Japan |
Ford Thailand Manufacturing | 1995 | Dearborn, USA |
Mazda Powertrain / Mazda Sales Thailand | 1998 | Hiroshima, Japan |
SAIC Motor–CP (MG) Thailand | 2012 | Shanghai, China |
Great Wall Motor Manufacturing | 2020 | Baoding, China |
BYD Thailand | 2024 | Shenzhen, China |
Mercedes-Benz Manufacturing Thailand | 1979 | Stuttgart, Germany |
BMW Manufacturing (Thailand) | 2000 | Munich, Germany |
Denso (Thailand) | 1972 | Kariya, Japan |
AAPICO Hitech | 1985 | Samut Prakan, Thailand |
Thai Summit Group | 1977 | Samut Prakan, Thailand |
Some of the Recent Competitor Trends and Key Information About Competitors Include:
Toyota Motor Thailand: As the largest automotive producer in the country, Toyota has accelerated its investment in hybrid and electric pickup development. In 2024, the company initiated pilot trials for battery-electric Hilux models and expanded localization of hybrid drivetrains at its Samut Prakan and Chachoengsao plants.
Isuzu Motors Thailand: Building on its dominance in the pickup segment, Isuzu announced a program to develop a fully electric D-MAX pickup for export markets. The company also upgraded its Chachoengsao plant with enhanced automation lines, strengthening throughput efficiency.
Mitsubishi Motors Thailand: Known for its strong SUV and pickup presence, Mitsubishi has launched its new Triton platform from the Laem Chabang facility. The company is also integrating more HEV variants into its lineup to comply with Thailand’s EV3.5 incentive framework.
Ford/AutoAlliance Thailand: Ford, in partnership with Mazda, reported strong export demand for the Ranger and Everest platforms. In 2024, Ford Thailand invested further in Industry 4.0 upgrades at its Rayong plant, boosting efficiency in welding and final assembly lines.
BYD Thailand: A major new entrant, BYD inaugurated its Rayong plant with an installed capacity of 150,000 units annually. The company has positioned Thailand as its key ASEAN production hub for BEVs, starting with the Atto 3 and Dolphin models, reflecting its aggressive expansion in Southeast Asia.
What Lies Ahead for Thailand Automotive Manufacturing Market?
The Thailand automotive manufacturing market is expected to evolve steadily through the decade, driven by its strong position as a regional export hub, rapid electrification programs, and policy backing under the government’s EV3.5 scheme. The combination of entrenched pickup and PPV leadership with new BEV and HEV investments positions Thailand to maintain its competitive role in Asia while adapting to the global shift toward electrified mobility.
Rise of Electrified and Hybrid Vehicle Programs: The future of Thailand’s automotive sector is closely tied to electrification, with global OEMs allocating battery electric and hybrid pickups, SUVs, and passenger cars to Thai plants. EV3.5-linked incentives will accelerate local pack assembly and e-axle production, while Chinese entrants such as BYD and Great Wall are expanding capacity. This pivot ensures that Thailand remains an export-competitive hub as demand for lower-emission vehicles rises in Asia and the Middle East.
Integration of Smart Manufacturing and Industry 4.0: Automation and data-driven operations are set to deepen across stamping, welding, and final assembly. OEMs and Tier-1 suppliers are deploying robotics, predictive maintenance, and MES systems to raise plant utilization and quality yield. These investments not only optimize takt times but also secure compliance with stricter safety and emissions regulations, ensuring that Thailand’s plants remain globally cost-competitive and attractive for new model allocations.
Expansion of Regional Export Corridors: Thailand’s automotive manufacturing industry will continue leveraging Laem Chabang port and the Eastern Economic Corridor to expand vehicle and component exports. Demand from ASEAN, Oceania, and Middle Eastern markets is expected to anchor throughput, while ongoing logistics upgrades and trade agreements will allow Thai-built pickups, SUVs, and BEVs to capture larger market share abroad. This reinforces Thailand’s role as the “Detroit of Asia,” supplying both conventional and electrified vehicles across global markets.
Sector-Specific Supplier Consolidation: As the industry shifts toward electrification, supplier consolidation will gain pace in high-value areas such as battery packs, semiconductors, and advanced electronics. Traditional suppliers of frames, engines, and interiors are diversifying portfolios to include e-axles, inverters, and thermal management systems. This structural change is expected to strengthen Tier-1 resilience while creating new entry points for specialized component makers within the Thai ecosystem.
Thailand Automotive Manufacturing Market Segmentation
By Vehicle Type
Pickup / PPV (light trucks)
Passenger Cars & SUVs / Crossovers
Commercial Vehicles (trucks, vans, buses)
By Propulsion / Powertrain
Internal Combustion Engine (ICE)
Hybrid / Mild Hybrid (HEV / MHEV)
Plug-in Hybrid (PHEV)
Battery Electric Vehicles (BEV)
Fuel Cell Electric Vehicles (FCEV)
By Assembly Type / Export Mode
Complete Built-Up Units (CBU)
CKD / SKD / Knock-Down (kits)
Contract / Toll Manufacturing / Joint-Venture Assembly
By Component Value-Add / System Level
Body / BIW & Structural
Powertrain & e-Powertrain (engine, transmission, e-motor, inverter, battery module)
Electrical / Electronics & Semiconductors
Interiors / Seating / Trim
Thermal / HVAC / Cooling / NVH systems
Players Mentioned in the Report:
Toyota Motor Thailand
Isuzu Motors Thailand
Honda Automobile (Thailand)
Mitsubishi Motors (Thailand)
Nissan Motor Thailand
Ford Thailand Manufacturing / AutoAlliance Thailand
Mazda Powertrain / Mazda Sales Thailand
SAIC Motor–CP (MG) Thailand
Great Wall Motor Manufacturing (Thailand)
BYD Thailand
Mercedes-Benz Manufacturing Thailand
BMW Manufacturing (Thailand)
Denso (Thailand) — Tier-1 systems
AAPICO Hitech — frames & modules
Thai Summit Group — body & structural
Key Target Audience
OEM strategy & regional HQ teams
Tier-1 and Tier-2 component manufacturers
Industrial real estate & vendor-park developers
Battery, e-powertrain, and electronics suppliers
Logistics & Ro-Ro operators / port authorities
Investments and venture capitalist firms
Government and regulatory bodies
Energy & utilities providers for industrial estates
Time Period:
Historical Period: 2019-2024
Base Year: 2025
Forecast Period: 2025-2030
Explore Flexible Purchase Options or Have Limited Budget?
Pay only for relevant chapters • Customizable report sections
Table of Contents
Choose individual sections to purchase. Mix and match as you like.
4.1. Delivery Model Analysis for Automotive Manufacturing-CKD, SKD, CBU, Contract Manufacturing, JV/Alliance [margins (THB/unit), buyer preference by model-type, strengths & weaknesses, capital intensity, quality/yield benchmarks]
4.2. Revenue Streams for Thailand Automotive Manufacturing Market [ex-factory sales, export rebates/duty drawback, KD kit exports, tooling & engineering services, after-sales kits, battery pack/ module sales]
4.3. Business Model Canvas for Thailand Automotive Manufacturing Market [key partners, key activities, value propositions, customer segments, channels, cost structure, revenue structure]
5.1. Contract/Flexible Lines vs Captive OEM Lines [line ownership models, utilization swing, model changeover time, SKU complexity]
5.2. Investment Models in Thailand Automotive Manufacturing [greenfield/brownfield, vendor park SPVs, BOI packages, PPP utilities, capex per installed unit]
5.3. Comparative Analysis of Model Allocation Funnels-Export-Led vs Domestic-Led Programs [homologation deltas, CO₂ tax impact, content-rule thresholds, lane economics]
5.4. Budget Allocation by OEM/Plant Size [capex/opex mix, automation share, maintenance & quality budgets, digital/Industry-4.0 spend]
8.1. Revenues, 2019-2024
9.1. By Market Structure (Captive, Contract, JV/Alliance, CKD, SKD), 2023-2024P [share in value %; utilization %]
9.2. By Vehicle Category (Pickup/PPV, Passenger Cars, SUVs/Crossovers, LCV, Luxury/Premium), 2023-2024P [mix %, ex-factory ASP (THB/unit)]
9.3. By Propulsion (ICE, HEV, PHEV, BEV, FCEV), 2023-2024P [penetration %, battery pack $/kWh, tax effect (THB/unit)]
9.4. By Component Value-Add (Powertrain & e-Powertrain, Electrical/Electronics, Chassis & BIW, Interiors, Thermal/NVH), 2023-2024P [value share %, localization %]
9.5. By Export Region (ASEAN, Oceania, Middle East & Africa, Europe, Americas), 2023-2024P [destination mix %, lane cost (THB/unit)]
9.6. By Manufacturing Cluster (EEC-Rayong/Chonburi/Chachoengsao; Samut Prakan/Pathum Thani; Others), 2023-2024P [plant count, robot density, utilities]
9.7. By Ownership/Origin (Japanese, American, European, Chinese, Thai JV/Independent), 2023-2024P [capacity share %, model/platform count]
9.8. By Mode of Final Delivery (Ro-Ro CBU, Containerized KD, Inland to Dealers), 2023-2024P [throughput, dwell time, damage/PPM]
10.1. Customer Landscape & Cohorts [fleet/commercial vs retail demand, pickup corridors, premium clusters, government procurement]
10.2. OEM Model Allocation & Decision Process [global platform economics, tariff & CO₂ calculus, supplier readiness gates, risk scoring]
10.3. Program Effectiveness & ROI [contribution margin by model, plant OEE/FPY impacts, export rebate realization, FX hedging efficacy]
10.4. Gap Analysis Framework [technology gaps, supplier depth gaps, infrastructure & logistics gaps, workforce skill gaps]
11.1. Trends & Developments for Thailand Automotive Manufacturing Market [xEV surge, ladder-frame modernization, lightweighting, OTA/ADAS penetration, Industry-4.0 rollouts]
11.2. Growth Drivers for Thailand Automotive Manufacturing Market [BOI incentives, EEC infrastructure, ASEAN access, mature supplier base, port capacity]
11.3. SWOT Analysis for Thailand Automotive Manufacturing Market [production depth, energy mix, export concentration, innovation index]
11.4. Issues & Challenges for Thailand Automotive Manufacturing Market [semiconductor volatility, freight cost swings, CO₂ taxation shifts, wage pressure, grid reliability]
11.5. Government Regulations for Thailand Automotive Manufacturing Market [excise by CO₂ bands, CKD/SKD/CBU duties, local content rules, TIS/UNECE homologation, EPR for batteries]
12.1. Market Size & Future Potential for xEV Manufacturing in Thailand, 2019-2030
12.2. Business Models & Revenue Streams [BEV packs/modules, e-axles, inverter/DC-DC, contract assembly, second-life batteries]
12.3. Production Models & Technology Stack [pack assembly lines, cell importing vs cell making, EMS partners, quality & safety standards]
15.1. Market Share of Key Players by Production/Revenue [OEM unit share %, value share %, propulsion mix]
15.2. Benchmark of Key Competitors [company overview, USP, product/platform portfolio, business model (captive/contract/JV), number of plants & installed capacity, utilization %, localization %, pricing/ASP bands, technology stack, major export lanes, strategic tie-ups, recent developments]
15.3. Operating Model Analysis Framework [make-to-order vs make-to-stock, JIT/JIS maturity, supplier Kanban coverage, yard & outbound]
15.4. “Magic Quadrant”-Style Positioning [leaders/challengers/visionaries/niche based on technology & cost]
15.5. Bowman’s Strategic Clock for Competitive Advantage [price-value positioning by OEM & Tier-1]
16.1. Revenues, 2025-2030
17.1. By Market Structure (Captive, Contract, JV/Alliance, CKD, SKD), 2025-2030 [value %, capacity adds, capex pipeline]
17.2. By Vehicle Category (Pickup/PPV, Passenger Cars, SUVs/Crossovers, LCV, Luxury/Premium), 2025-2030 [mix %, ASP bands]
17.3. By Propulsion (ICE, HEV, PHEV, BEV, FCEV), 2025-2030 [penetration %, pack $/kWh trajectory, policy impact]
17.4. By Component Value-Add (Powertrain & e-Powertrain, Electrical/Electronics, Chassis & BIW, Interiors, Thermal/NVH), 2025-2030 [value pool shifts]
17.5. By Export Region (ASEAN, Oceania, Middle East & Africa, Europe, Americas), 2025-2030 [lane mix, logistics cost]
17.6. By Manufacturing Cluster (EEC; Samut Prakan/Pathum Thani; Others), 2025-2030 [capacity, utilities, land take-up]
17.7. By Mode of Final Delivery (Ro-Ro CBU, Containerized KD, Inland), 2025-2030 [throughput, dwell time]
17.8. By Ownership/Origin (Japanese, American, European, Chinese, Thai JV/Independent), 2025-2030 [capacity share, new entrants]
Discuss a Customized Research Scope
Custom research scope • Tailored insights • Industry expertise
Research Methodology
Step 1: Ecosystem Creation
Map the end-to-end Thailand Automotive Manufacturing ecosystem, covering both demand and supply sides. Demand-side entities include domestic buyers (fleet/operators, rental/leasing, government procurement), export destinations (ASEAN, Oceania, Middle East, Europe, Americas), distributors/dealers, and financing partners. Supply-side entities span OEMs, contract assemblers/JVs, Tier-1/2/3 suppliers (frames/BIW, powertrain & e-powertrain, E/E & semiconductors, interiors, thermal/NVH), tooling & die makers, testing/validation labs, industrial estate developers, logistics (Ro-Ro, container lines, ICDs), and enablers (energy/water utilities, scrap/recyclers, workforce pipelines). Policy and standards nodes include BOI, EECO/EEC, DLT, DIW, TISI, Customs, and port authorities (Laem Chabang, Map Ta Phut). Based on this map, shortlist 5–6 leading OEMs/Tier-1s in Thailand using objective screens: audited financials and capex, installed capacity and utilization, export lanes and destination breadth, platform/model span, localization depth, robot density/OEE, supplier breadth, and after-sales parts programs. Sourcing leverages industry articles, ministerial portals, and proprietary databases to consolidate ecosystem and leadership views.
Step 2: Desk Research
Conduct exhaustive desk research using diversified sources to construct a market-level baseline. Compile time series for production, exports, and plant capacity; map propulsion mix (ICE/HEV/PHEV/BEV); and catalog assembly types (CKD/SKD/CBU). Extract company-level disclosures (press releases, annual reports, sustainability filings, BOI announcements) for model allocations, capex, commissioning timelines, localization programs (e-axle, pack modules), and vendor-park footprints. Gather port statistics (Ro-Ro calls, TEUs, dwell times), trade data by HS code (CBU/KD/parts), and standards/compliance (TIS/UNECE). Build a should-cost/BOM view by major systems, triangulating with commodity indices (steel/aluminum/polymers) and typical content per vehicle. Assemble a pricing/ASP band proxy for export vs domestic programs (without publishing sensitive prices), and a risk register covering chips/MCUs, logistics, and policy shifts. The outcome is a harmonized dataset to seed sizing models and competitor benchmarks.
Step 3: Primary Research
Run structured interviews with C-level and plant leadership across OEMs, Tier-1s, logistics providers, estate developers, testing labs, and policymakers. Objectives: (a) validate model allocations, line rates, and utilization windows; (b) confirm localization milestones for e-powertrain (pack, inverter, drive unit), engines/transmissions, and E/E harnesses; (c) quantify export lane realities (frequency, yard throughput, damage/PPM controls); (d) stress-test assumptions on EV3.5 compliance, supplier readiness, and commissioning slippages; and (e) gather OEE/FPY/PPM bands and maintenance practices that influence output quality and cost. Deploy a bottom-to-top approach, rolling plant/line contributions into company totals, then aggregating to market level. As part of validation, conduct masked buyer journeys (pretend procurement and RFQ interactions) with selected suppliers/logistics firms to corroborate lead times, minimum order logistics, packaging specs, and capacity commitments. Cross-check claims against customs panels and port windows to anchor reality.
Step 4: Sanity Check
Execute bi-directional triangulation: (1) Bottom-up—sum verified plant outputs (by platform and propulsion), apply verified takt/shift patterns, scrap/yield, and planned outages; (2) Top-down—align with official production/export series, port flows, and HS-level trade values. Run reconciliation loops for gaps > a defined threshold (e.g., model-level to customs variance), prioritize on-site clarifications, and re-interview stakeholders as required. Stress-test the consolidated model through scenario blocks (FX bands, commodity shocks, chip availability, policy cadence) and a capacity-ramp curve for new EV lines. Lock the final dataset only after passing internal peer review (method, sources, and math checks) and source traceability (every figure linked to an origin). The signed-off output becomes the basis for the report’s market sizing, segmentation, competitive benchmarking, and forward outlook.
See What's Inside the Report
Get a preview of key findings, methodology and report coverage
Frequently Asked Questions
The Thailand Automotive Manufacturing Market is positioned as one of Asia’s most significant production hubs, with total vehicle output reaching 1,841,663 units in 2023. Backed by a long-standing pickup truck ecosystem, world-class supplier clusters, and export connectivity through Laem Chabang port, Thailand continues to serve as the “Detroit of Asia.” The market’s potential is reinforced by new investments in battery electric vehicles, supported by the government’s EV3.5 scheme and the entry of global players like BYD and Great Wall, which ensures diversification into electrified production.
The Thailand Automotive Manufacturing Market is led by global OEMs such as Toyota, Isuzu, Honda, Mitsubishi, Nissan, and Ford (AutoAlliance JV). These companies dominate through deep local supplier bases, long-term model allocations, and established export networks. New entrants like BYD, SAIC Motor (MG), and Great Wall Motor are reinforcing electrification pathways, while premium brands such as BMW and Mercedes-Benz maintain local assembly for luxury segments. Tier-1 suppliers including Denso, AAPICO Hitech, and Thai Summit Group provide critical support across frames, powertrain, and electronic systems.
Key growth drivers include Thailand’s strong trade flows, which recorded merchandise exports of USD 197,192.8 million in the first eight months of 2024, ensuring robust throughput for vehicles and parts. The government’s EV3.5 incentive program further fuels investment in electrification by linking subsidies to local production commitments. In addition, the Eastern Economic Corridor’s infrastructure and industrial estate ecosystem underpin Thailand’s position as a preferred ASEAN hub, with Laem Chabang port handling 9.46 million TEU in FY2024, enabling seamless exports.
The sector faces significant headwinds from weak domestic consumption, as household debt reached THB 16.42 trillion by Q4 2024, limiting vehicle loan approvals. Export reliance exposes manufacturers to volatility, with Bank of Thailand noting headwinds for auto and parts shipments in recent reports. Furthermore, heavy dependence on imported semiconductors and electronics—contributing to a goods import bill of USD 203,543.8 million in the first eight months of 2024—creates vulnerability in supply chains, affecting both ICE and EV production schedules.
License Options
PDF + Excel
Complete report package
$4,000
Excel Only
Data and analytics
$2,500
Custom Sections
Starts from $100
$0