UAE Cold Chain Market Outlook to 2029
By Market Structure, By Storage Type (Cold Storage, Cold Transportation), By End-User (Food and Beverage, Pharmaceuticals, Chemicals, and Others), By Temperature Range, and By Region.
Report Overview
Report Code
TDR0193
Coverage
Middle East
Published
May 2025
Pages
80
Flexible Purchase Options
Select and purchase only the chapters you need for your strategic decisions
On This Page
Report Overview
The report titled “UAE Cold Chain Market Outlook to 2029 - By Market Structure, By Storage Type (Cold Storage, Cold Transportation), By End-User (Food and Beverage, Pharmaceuticals, Chemicals, and Others), By Temperature Range, and By Region.” provides a comprehensive analysis of the cold chain industry in the UAE. The report covers an overview and genesis of the industry, overall market size in terms of revenue, market segmentation; trends and developments, regulatory landscape, customer level profiling, issues and challenges, and comparative landscape including competition scenario, cross comparison, opportunities and bottlenecks, and company profiling of major players in the Cold Chain Market.
Report Coverage
Verified Market Sizing
Multi-layer forecasting with historical data and 5–10 year outlook
Deep-Dive Segmentation
Cross-sectional analysis by product type, end user, application and region
Competitive Benchmarking & Positioning
Market share, operating model, pricing and competition matrices
Actionable Insights & Risk Assessment
High-growth white spaces, underserved segments, technology disruptions and demand inflection points
Review Methodology & Data Structure
Preview report structure, data sources and research framework
Executive Summary
The report titled “UAE Cold Chain Market Outlook to 2029 - By Market Structure, By Storage Type (Cold Storage, Cold Transportation), By End-User (Food and Beverage, Pharmaceuticals, Chemicals, and Others), By Temperature Range, and By Region.” provides a comprehensive analysis of the cold chain industry in the UAE. The report covers an overview and genesis of the industry, overall market size in terms of revenue, market segmentation; trends and developments, regulatory landscape, customer level profiling, issues and challenges, and comparative landscape including competition scenario, cross comparison, opportunities and bottlenecks, and company profiling of major players in the Cold Chain Market. The report concludes with future market projections based on sales revenue, by market, product types, region, cause and effect relationship, and success case studies highlighting the major opportunities and cautions.
UAE Cold Chain Market Overview and Size
The UAE cold chain market reached a valuation of AED 5.8 Billion in 2023, driven by increasing demand for perishable goods, the expansion of organized retail and food services, and a growing pharmaceutical sector requiring stringent temperature-controlled logistics. The market is characterized by major players such as Al-Futtaim Logistics, Mohebi Logistics, RSA Cold Chain, and Agility Logistics. These companies are recognized for their advanced infrastructure, comprehensive service offerings, and emphasis on quality assurance and compliance.
In 2023, RSA Cold Chain expanded its cold storage capacity in Dubai by launching a new facility with multi-temperature zones catering to food and healthcare sectors. This move was aimed at strengthening its presence in a market increasingly driven by food security initiatives and pharmaceutical trade. Key markets include Dubai, Abu Dhabi, and Sharjah due to their strong industrial bases and international trade hubs.
Market Size for UAE Cold Chain Industry on the Basis of Revenues in USD Million, 2018-2023

What Factors are Leading to the Growth of UAE Cold Chain Market:
Economic Diversification and Trade Growth: The UAE’s ongoing focus on diversifying its economy beyond oil, with heavy investments in the logistics and food sectors, has increased demand for efficient cold chain solutions. In 2023, cold chain logistics supported over 25% of food imports into the country, ensuring the safe handling of perishables amidst rising consumption patterns.
Healthcare Sector Expansion: The surge in pharmaceutical imports, including vaccines and biologics requiring strict temperature control, has significantly propelled the cold chain market. The UAE governments' healthcare initiatives, including Dubai Health Strategy 2021, have emphasized the need for robust cold logistics systems to support pharmaceutical supply chains.
Technological Advancements: Adoption of IoT, real-time tracking systems, and automation in warehousing has enhanced operational efficiency and reliability in the cold chain sector. In 2023, over 35% of cold chain warehouses in the UAE integrated smart monitoring solutions to ensure compliance with stringent storage standards for sensitive goods.
Which Industry Challenges Have Impacted the Growth for UAE Cold Chain Market
High Operational Costs: Maintaining temperature-controlled environments across transportation and storage involves substantial energy and infrastructure costs. According to industry estimates, approximately 40% of cold chain operational expenses are attributed to energy consumption alone. These high costs have made it challenging for smaller players to compete and expand, limiting market accessibility and scalability.
Limited Skilled Workforce: There is a significant shortage of trained professionals skilled in handling specialized cold chain logistics operations such as temperature-sensitive storage, real-time monitoring, and regulatory compliance. In a 2023 survey, nearly 30% of logistics companies in the UAE cited workforce shortages as a critical operational bottleneck, impacting service quality and increasing reliance on automation and technology.
Infrastructure Bottlenecks in Remote Regions: While major hubs like Dubai and Abu Dhabi boast advanced cold storage and transportation networks, remote areas and smaller emirates face infrastructure limitations. Approximately 18% of perishable goods transported outside major cities experienced spoilage or compliance failures in 2023, primarily due to insufficient cold chain infrastructure at the last-mile delivery stage.
What are the Regulations and Initiatives which have Governed the Market:
Food Safety Regulations: The UAE has implemented strict food safety regulations under the Emirates Authority for Standardization and Metrology (ESMA) and the Abu Dhabi Agriculture and Food Safety Authority (ADAFSA) to ensure quality throughout the cold chain. These regulations require mandatory temperature monitoring, hygiene certifications, and traceability systems for all food-related cold chain operators. In 2023, over 85% of inspected facilities complied with these regulations on their first audit.
Pharmaceutical Compliance Standards: In line with international standards such as GDP (Good Distribution Practice) and WHO guidelines, the UAE government mandates specialized storage and transportation for pharmaceuticals. In 2023, compliance with GDP standards became a critical requirement for licensing of pharmaceutical cold chain operators, resulting in a 12% increase in certifications issued compared to 2022.
Sustainability Initiatives and Green Logistics: The UAE government has emphasized sustainable logistics through initiatives like the Dubai Clean Energy Strategy 2050, encouraging cold chain companies to adopt energy-efficient technologies and reduce carbon emissions. In 2023, nearly 20% of new cold storage facilities integrated solar-powered cooling systems, and hybrid cold transport fleets were introduced to align with national sustainability goals.
UAE Cold Chain Market Segmentation
By Market Structure: Organized players dominate the UAE cold chain market, driven by the country’s stringent regulatory environment, focus on quality, and the demand from global food and pharmaceutical brands. Large organized companies offer certified, end-to-end temperature-controlled solutions, ensuring compliance and reliability. Meanwhile, unorganized players primarily cater to smaller businesses and local markets, often providing cost-effective but limited services.
By Storage Type: Cold Storage facilities contribute a higher share to the cold chain market, given the significant demand for warehousing perishable goods like meat, dairy products, fruits, and pharmaceuticals. Cold Transportation also holds a sizable share, especially for sectors like foodservice and pharmaceuticals where last-mile delivery reliability is crucial. Investments in refrigerated trucks and temperature-controlled containers have notably increased in recent years.
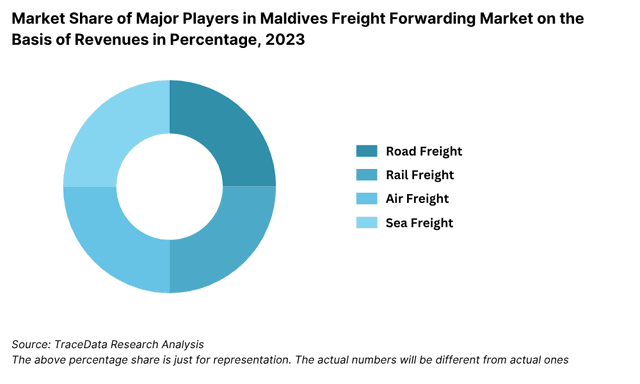
By End-User: The Food and Beverage sector leads the cold chain demand in the UAE, largely due to the country’s dependence on food imports, accounting for nearly 85% of food consumption. Pharmaceuticals are the second-largest end-user, fueled by the growth of healthcare services, increasing pharmaceutical imports, and the UAE’s emergence as a medical tourism hub. Chemicals and other industrial goods also represent a growing segment, driven by increased manufacturing and exports.
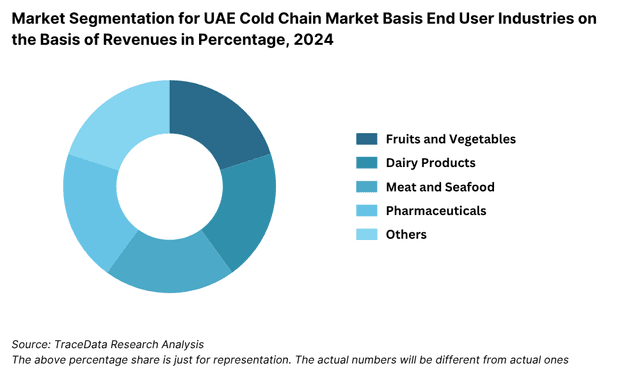
Competitive Landscape in UAE Cold Chain Market
The UAE cold chain market is relatively concentrated, with a few major players dominating the space. However, the entry of specialized logistics firms and the expansion of infrastructure by players such as Al-Futtaim Logistics, Mohebi Logistics, RSA Global, Agility Logistics, and Transcorp International have diversified the market, offering customers enhanced solutions for temperature-controlled storage and transportation.
| Company Name | Founding Year | Original Headquarters |
| RSA Cold Chain (RSA Global) | 2009 | Dubai, United Arab Emirates |
| Al-Futtaim Logistics (Cold Chain Division) | 1980 | Dubai, United Arab Emirates |
| GAC Dubai (Cold Chain Services) | 1956 | Gothenburg, Sweden |
| Mohebi Logistics (Cold Chain Division) | 1991 | Dubai, United Arab Emirates |
| Tristar Transport (Cold Chain Fleet) | 1998 | Dubai, United Arab Emirates |
| Al Madina Logistics Services LLC | 2007 | Muscat, Oman (UAE Operations) |
| Global Shipping & Logistics LLC (GSL) | 2005 | Dubai, United Arab Emirates |
| Integrated Freight & Logistics (IFL) | 2008 | Dubai, United Arab Emirates |
| Agility Logistics UAE (Cold Chain) | 1979 | Kuwait City, Kuwait |
| Aramex (Temperature-Controlled Freight) | 1982 | Dubai, United Arab Emirates |
| Kuehne + Nagel UAE (Pharma & Cold Chain) | 1890 (UAE: ~1990s) | Schindellegi, Switzerland |
| DHL Supply Chain UAE (Life Sciences & Cold Chain) | 1969 (UAE: ~1980s) | Bonn, Germany |
| DB Schenker UAE (Cold Chain Logistics) | 1872 (UAE: ~2000s) | Essen, Germany |
| Lineage Logistics UAE (via acquisition of Emergent Cold) | 2008 (UAE: ~2020s) | Novi, Michigan, USA |
| Maersk UAE (Cold Chain Solutions) | 1904 (UAE: ~2000s) | Copenhagen, Denmark |
| CEVA Logistics UAE | 2006 (UAE: ~2007) | Marseille, France |
Some of the recent competitor trends and key information about competitors include:
Al-Futtaim Logistics: A leading player in integrated logistics solutions, Al-Futtaim expanded its cold chain division in 2023 by launching an advanced multi-temperature warehouse facility in Dubai Industrial City. This expansion aims to cater to rising demand from the food and pharmaceutical sectors.
Mohebi Logistics: Known for its specialization in FMCG and food logistics, Mohebi Logistics saw a 22% growth in its cold storage capacity in 2023. The company's heavy investment in automation and real-time inventory monitoring has enhanced service efficiency and operational transparency.
RSA Global (RSA Cold Chain): RSA Global reported a 30% year-on-year increase in its cold chain business in 2023, fueled by strategic partnerships with healthcare and food service companies. Their innovative use of IoT for temperature tracking has significantly boosted service reliability and regulatory compliance.
Agility Logistics: Although headquartered in Kuwait, Agility maintains a strong operational footprint in the UAE. In 2023, Agility invested in a fleet of eco-friendly refrigerated vehicles to align with the UAE’s sustainability initiatives. The company reported a 15% increase in cold chain service contracts within Dubai and Abu Dhabi markets.
Transcorp International: Specializing in last-mile cold transportation, Transcorp International expanded its services in 2023 to include temperature-controlled e-commerce delivery for groceries and pharmaceuticals. The company recorded a 17% rise in delivery volumes, particularly in urban centers such as Dubai Marina and Downtown Dubai.
What Lies Ahead for UAE Cold Chain Market?
The UAE cold chain market is projected to grow steadily by 2029, exhibiting a healthy CAGR during the forecast period. This growth is expected to be fueled by factors such as increasing food imports, expansion of the pharmaceutical sector, rising e-commerce in perishables, and heightened government focus on food security and healthcare infrastructure.
Expansion of Pharmaceutical Cold Chain: With the UAE positioning itself as a healthcare hub for the Middle East, the demand for specialized pharmaceutical cold chain services, including for biologics, vaccines, and temperature-sensitive medicines, is expected to rise significantly. New investments in GDP-certified storage and transportation facilities are anticipated, supporting the growth of this segment.
Integration of Smart Technologies: Technologies such as IoT, AI-based predictive maintenance, and blockchain for traceability are expected to transform the UAE cold chain landscape. Real-time monitoring systems and automated temperature regulation will enhance operational efficiency, reduce spoilage, and build stronger trust among end-users, particularly in the food and pharmaceutical sectors.
Growth of E-commerce and Last-Mile Delivery: The rise of online grocery platforms and direct-to-consumer pharmaceutical delivery services is projected to drive demand for sophisticated last-mile cold transportation solutions. Companies investing in flexible, scalable, and technology-driven last-mile cold chain logistics will be well-positioned to capitalize on this emerging opportunity.
Focus on Sustainability and Energy Efficiency: Amid increasing environmental concerns and the UAE’s commitment to net-zero emissions by 2050, cold chain companies are expected to adopt greener practices. This includes investments in solar-powered warehouses, energy-efficient refrigeration systems, eco-friendly vehicles, and carbon offset initiatives. Sustainability will increasingly become a competitive differentiator in the UAE cold chain market.
Future Outlook and Projections for UAE Cold Chain Market on the Basis of Revenues in USD Million, 2024-2029


UAE Cold Chain Market Segmentation
- By Market Structure:
o Organized Sector
o Unorganized Sector - By Storage Type:
o Cold Storage
o Cold Transportation - By End-User:
o Food and Beverage
o Pharmaceuticals
o Chemicals
o Retail and E-commerce
o Industrial and Others - By Temperature Range:
o Chilled (0°C to 8°C)
o Frozen (-18°C and below)
o Controlled Ambient (15°C to 25°C) - By Region:
o Dubai
o Abu Dhabi
o Sharjah
o Northern Emirates (Ajman, Ras Al Khaimah, Fujairah, Umm Al-Quwain)
Players Mentioned in the Report:
· CEVA Logistics
· Mohebi Logistics
· RHS Logistics
· GAC Dubai
· Global Shipping and Logistics LLC
· Agility Logistics
· RSA Cold Chain
· O.Reefers (Al Shirawi Group)
· Total Freight International (TFI)
· Maersk UAE
· Kuehne + Nagel UAE
· DHL Global Forwarding UAE
· Emirates SkyCargo
· Aipex Worldwide
· Petit Forestier UAE
· Transcorp
· Shipa Delivery
· Al-Futtaim Logistics
· ProConnect Integrated Logistics
· Triburg Freight Services
Key Target Audience:
- Cold Storage Facility Providers
- Cold Transportation and Logistics Companies
- Food Importers and Distributors
- Pharmaceutical and Healthcare Companies
- Retail Chains and E-commerce Grocery Platforms
- Government Regulatory Authorities (e.g., ESMA, ADAFSA)
- Investment and Infrastructure Development Firms
- Research and Development Institutions
Time Period:
- Historical Period: 2018-2023
- Base Year: 2024
- Forecast Period: 2024-2029
Explore Flexible Purchase Options or Have Limited Budget?
Pay only for relevant chapters • Customizable report sections
Table of Contents
Choose individual sections to purchase. Mix and match as you like.
6.1. Revenues, 2018-2024P
7.1. By Cold Storage and Cold Transport, 2023-2024P
7.2. By End-User Application (Dairy Products, Meat and Seafood, Pharmaceuticals, Fruits and Vegetables and Others), 2023-2024P
7.3. By Ownership (Owned and 3PL Cold Chain Facilities), 2023-2024P
10.1. UAE Cold Storage Market Size
10.1.1. By Revenue, 2018-2024P
10.1.2. By Number of Pallets, 2018-2024P
10.2. UAE Cold Storage Market Segmentation
10.2.1. By Temperature Range (Ambient, Chilled and Frozen), 2023-2024P
10.2.2. By End-User Application (Dairy Products, Meat and Seafood, Pharmaceuticals, Fruits and Vegetables and Others), 2023-2024P
10.2.3. By Major Cities, 2023-2024P
10.3. UAE Cold Storage Market Future Outlook and Projections, 2025-2029
10.3.1. By Temperature Range (Ambient, Chilled and Frozen), 2025-2029
10.3.2. By Major Cities, 2025-2029
11.1. UAE Cold Transport Market Size (By Revenue and Number of Reefer Trucks), 2018-2024P
11.2. UAE Cold Transport Market Segmentation
11.2.1. By Mode of Transportation (Land, Sea and Air), 2023-2024P
11.2.2. By Location (Domestic and International), 2023-2024P
11.3. UAE Cold Transport Market Future Outlook and Projections, 2025-2029
11.3.1. By Mode of Transport (Land, Sea and Air), 2025-2029
11.3.2. By Location (Domestic and International), 2025-2029
12.1. Trends and Developments in UAE Cold Chain Market
12.2. Issues and Challenges in UAE Cold Chain Market
12.3. Decision Making Parameters for End Users in UAE Cold Chain Market
12.4. SWOT Analysis of UAE Cold Chain Industry
12.5. Government Regulations and Associations in UAE Cold Chain Market
12.6. Macroeconomic Factors Impacting UAE Cold Chain Market
13.1. Parameters to be covered for Each End Users to Determine Business Potential:
13.1.1. Production Clusters
13.1.2. Market Demand, Major Products Stored, Cold Storage Companies in Guwahati catering to End Users
13.1.3. Location Preference for Each End User and their Production Plants, Preferences for Outsourcing and Captive Facility, Services Required, Facility Preferences, Decision Making Parameters
13.1.4. Cross comparison of leading end users/companies based on Headquarters, Manufacturing Plants, Products Stored, Major Products, Total Production, Cold Chain Partner, Facility Outsourced/Captive, Pallets Owned/Hired, Contact Person, Address and others
16.1. Competitive Landscape in UAE Cold Chain Market
16.2. Competition Scenario in UAE Cold Chain Market (Competition Stage, Major Players, Competing Parameters)
16.3. Key Metrics (Temperature Range, Pallet Position, Prices Charged, Occupancy Rate, Revenue (2023) and Employee Base) for Major Players in UAE Cold Chain Market
16.4. Company Profiles of Major Companies in UAE Cold Chain Market (Year of Establishment, Company Overview, Service Offered, USP, Warehousing Facilities, Warehousing Price, Cold Storage by location, Occupancy Rate, Major Clientele, Industries Catered, Employee Base, Temperature Range, Topline OPEX*, Revenue, Recent Developments, Future Strategies)
16.5. Strength and Weakness
16.6. Operating Model Analysis Framework
16.7. Gartner Magic Quadrant
16.8. Bowmans Strategic Clock for Competitive Advantage
17.1. Revenues, 2025-2029
18.1. By Cold Storage and Cold Transport, 2025-2029
18.2. By End-User Application (Dairy Products, Meat and Seafood, Pharmaceuticals, Fruits and Vegetables and Others), 2025-2029
18.3. By Ownership (Owned and 3PL Cold Chain Facilities), 2025-2029
18.4. Recommendation
18.5. Opportunity Analysis
Discuss a Customized Research Scope
Custom research scope • Tailored insights • Industry expertise
Research Methodology
Step 1: Ecosystem Creation
Map the ecosystem and identify all the demand side and supply side entities for Malaysia Used Car Market. Basis this ecosystem, we will shortlist leading 5-6 producers in the country based upon their financial information, production capacity/volume.
Sourcing is made through industry articles, multiple secondary, and proprietary databases to perform desk research around the market to collate industry-level information.
Step 2: Desk Research
Subsequently, we engage in an exhaustive desk research process by referencing diverse secondary and proprietary databases. This approach enables us to conduct a thorough analysis of the market, aggregating industry-level insights. We delve into aspects like the sales revenues, number of market players, price level, demand, and other variables. We supplement this with detailed examinations of company-level data, relying on sources like press releases, annual reports, financial statements, and similar documents. This process aims to construct a foundational understanding of both the market and the entities operating within it.
Step 3: Primary Research
We initiate a series of in-depth interviews with C-level executives and other stakeholders representing various Malaysia Used Car Market companies and end-users. This interview process serves a multi-faceted purpose: to validate market hypotheses, authenticate statistical data, and extract valuable operational and financial insights from these industry representatives. Bottom to top approach is undertaken to evaluate volume sales for each player thereby aggregating to the overall market.
As part of our validation strategy, our team executes disguised interviews wherein we approach each company under the guise of potential customers. This approach enables us to validate the operational and financial information shared by company executives, corroborating this data against what is available in secondary databases. These interactions also provide us with a comprehensive understanding of revenue streams, value chain, process, pricing, and other factors.
Step 4: Sanity Check
- Bottom to top and top to bottom analysis along with market size modeling exercises is undertaken to assess sanity check process.
See What's Inside the Report
Get a preview of key findings, methodology and report coverage
Frequently Asked Questions
The Malaysia used car market is poised for substantial growth, reaching a valuation of MYR 12 Billion in 2023. This growth is driven by factors such as the increasing demand for affordable transportation, a growing middle class, and the shift towards more cost-effective vehicle options. The market's potential is further bolstered by the expanding digital landscape, which facilitates easier access to a wide range of used vehicles.
The Malaysia Used Car Market features several key players, including Mudah.my, Carlist.my, and Carsome. These companies dominate the market due to their extensive distribution networks, strong brand presence, and diverse vehicle offerings. Other notable players include myTukar and Sime Darby Auto Selection.
The primary growth drivers include economic factors, such as the high cost of new cars and economic downturns, which make used cars a more attractive option. The expanding middle class in Malaysia, combined with increased urbanization, also contributes to the growing demand for used cars. Additionally, the rise of digital platforms has made it easier for consumers to access a wider selection of vehicles, enhancing Malaysia Used Car Market growth.
The Malaysia Used Car Market faces several challenges, including quality and trust issues related to the condition and history of used vehicles. Regulatory challenges, such as stringent vehicle inspection and emission standards, can also impact the availability of older models. Additionally, infrastructure challenges, including inadequate dealership networks and the need for improved after-sales services, pose significant barriers to market growth.
License Options
PDF + Excel
Complete report package
$4,000
Excel Only
Data and analytics
$2,500
Custom Sections
Starts from $100
$0