Uganda Cold Chain Market Outlook to 2029
By Market Structure (Cold Storage and Cold Transportation), By End-User Industry (Pharmaceuticals, Dairy, Meat & Seafood, Fruits & Vegetables, and Others), By Temperature Type (Chilled and Frozen), and By Region
Report Overview
Report Code
TDR0331
Coverage
Africa
Published
September 2025
Pages
80
On This Page
Report Overview
The report titled “Uganda Cold Chain Market Outlook to 2029 – By Market Structure (Cold Storage and Cold Transportation), By End-User Industry (Pharmaceuticals, Dairy, Meat & Seafood, Fruits & Vegetables, and Others), By Temperature Type (Chilled and Frozen), and By Region” provides a comprehensive analysis of the cold chain market in Uganda. The report covers an overview and genesis of the industry, overall market size in terms of revenue, market segmentation, trends and developments, regulatory landscape, customer level profiling, issues and challenges, and comparative landscape including competition scenario, cross comparison, opportunities and bottlenecks, and company profiling of major players in...
Report Coverage
Verified Market Sizing
Multi-layer forecasting with historical data and 5–10 year outlook
Deep-Dive Segmentation
Cross-sectional analysis by product type, end user, application and region
Competitive Benchmarking & Positioning
Market share, operating model, pricing and competition matrices
Actionable Insights & Risk Assessment
High-growth white spaces, underserved segments, technology disruptions and demand inflection points
Review Methodology & Data Structure
Preview report structure, data sources and research framework
Executive Summary
The report titled “Uganda Cold Chain Market Outlook to 2029 – By Market Structure (Cold Storage and Cold Transportation), By End-User Industry (Pharmaceuticals, Dairy, Meat & Seafood, Fruits & Vegetables, and Others), By Temperature Type (Chilled and Frozen), and By Region” provides a comprehensive analysis of the cold chain market in Uganda. The report covers an overview and genesis of the industry, overall market size in terms of revenue, market segmentation, trends and developments, regulatory landscape, customer level profiling, issues and challenges, and comparative landscape including competition scenario, cross comparison, opportunities and bottlenecks, and company profiling of major players in the cold chain ecosystem. The report concludes with future market projections based on revenue, segment-wise outlook, region-wise potential, cause and effect relationships, and success case studies highlighting major opportunities and risks.
Uganda Cold Chain Market Overview and Size
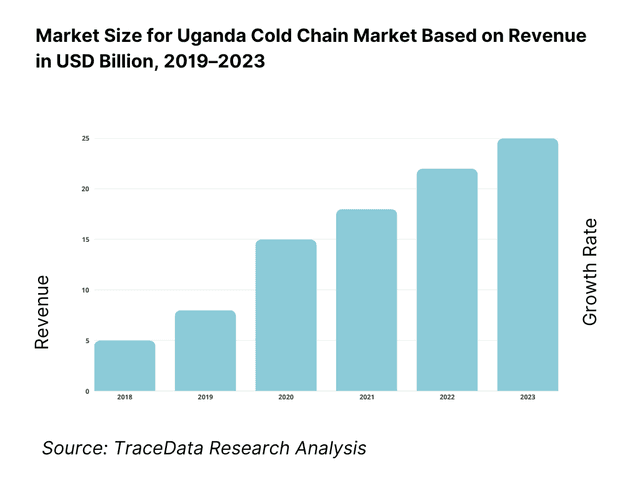
The Uganda cold chain market reached a valuation of UGX 400 Billion in 2023, driven by the increasing need for temperature-controlled logistics in the pharmaceutical and perishable food sectors. The market is characterized by emerging players such as Freight in Time, Movit Products, Farmgain Africa, and Tropical General Investments. These companies are gradually expanding their cold storage capacities and refrigerated transportation fleets to meet the growing demand.
In 2023, Freight in Time inaugurated a new cold storage warehouse in Kampala with advanced monitoring systems and modular cooling units to support pharmaceutical and agro-food supply chains. Kampala and Entebbe remain the most significant cold chain hubs due to their proximity to key ports, airports, and dense consumer markets.
What Factors are Leading to the Growth of Uganda Cold Chain Market:
Rise in Pharmaceutical and Vaccine Demand: The post-COVID focus on vaccine distribution and health infrastructure has led to a surge in the requirement for reliable cold chain logistics. Uganda's Ministry of Health has scaled up procurement and distribution of temperature-sensitive vaccines, which has significantly driven demand for cold storage and transport solutions.
Perishable Food Exports and Imports: With the growth in export-oriented agriculture (fruits, flowers, fish), there is a growing need for cold chains to reduce post-harvest losses. In 2023, over 25% of horticultural and fishery exports from Uganda required a cold chain backbone, primarily to the EU and Middle East markets.
Government and Donor-Led Initiatives: Support from development agencies and the Ugandan government—especially under initiatives like the Agriculture Cluster Development Project (ACDP)—has catalyzed investment in cold chain infrastructure. Grants and public-private partnerships are helping to modernize cold facilities in regional hubs such as Gulu and Mbarara.
Which Industry Challenges Have Impacted the Growth for Uganda Cold Chain Market
Infrastructure Gaps and Power Reliability: One of the most significant challenges facing the Ugandan cold chain market is the lack of consistent power supply and limited cold storage infrastructure in rural and semi-urban areas. According to recent assessments, over 60% of agricultural producers in Uganda do not have access to reliable cold storage facilities. Power outages—averaging 8 to 10 hours per week—frequently compromise the integrity of stored perishable goods, resulting in product spoilage and financial losses.
High Operational Costs: Running cold chain systems is capital and energy-intensive, particularly in regions with unreliable grid electricity. Operators often rely on diesel generators, which increases costs by up to 30% compared to markets with stable electricity. These high operating costs deter small and mid-sized businesses from entering or scaling operations within the cold chain ecosystem.
Limited Skilled Workforce and Technical Know-How: The lack of specialized training programs and skilled technicians for handling, maintaining, and monitoring cold chain systems has created operational inefficiencies. Approximately 45% of surveyed cold chain operators in Uganda report difficulties in recruiting trained personnel, resulting in lower system uptime and reduced service quality.
What are the Regulations and Initiatives which have Governed the Market
National Agricultural Policy and Cold Chain Promotion: The Ugandan government, through its National Agricultural Policy and the Uganda National Export Development Strategy, has emphasized the importance of post-harvest handling and cold chain development. Government support programs under the Ministry of Agriculture have provided co-funding for refrigerated storage projects aimed at reducing post-harvest losses, particularly in fruit and vegetable clusters.
UNBS and Regulatory Compliance for Perishable Goods: The Uganda National Bureau of Standards (UNBS) mandates specific temperature and hygiene protocols for the transport and storage of perishable items. As of 2023, over 70% of certified cold chain operators comply with UNBS-prescribed handling standards, especially for fishery and dairy exports.
Donor-Backed Infrastructure and Cold Chain Modernization Programs: Multiple donor-led programs, including USAID’s Feed the Future initiative and the World Bank’s Agriculture Cluster Development Project (ACDP), are investing in improving cold chain logistics in Uganda. These programs have led to the installation of over 25 solar-powered cold storage units in remote agricultural zones since 2021.
Uganda Cold Chain Market Segmentation
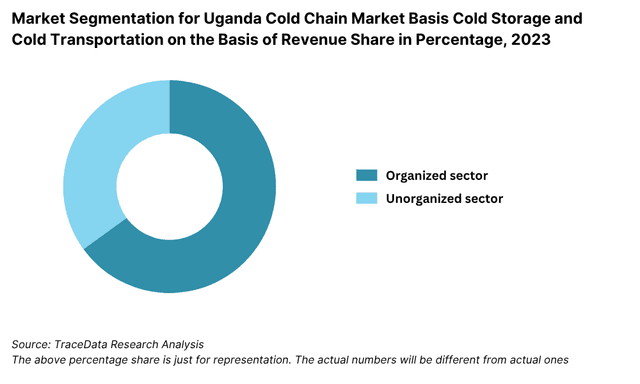
By Market Structure: Cold storage facilities dominate the market structure in Uganda, driven by increasing demand for longer-term preservation of perishable goods such as fish, meat, and dairy products. These facilities are typically located in urban centers like Kampala, Entebbe, and Jinja, where infrastructure and power supply are relatively more reliable. Cold transportation—primarily through refrigerated trucks—forms the other key segment, gaining traction with the rise of retail chains and pharma distributors requiring end-to-end cold logistics. However, due to the high operational costs, cold transport services are still in the growth phase and remain largely fragmented among small-scale players.
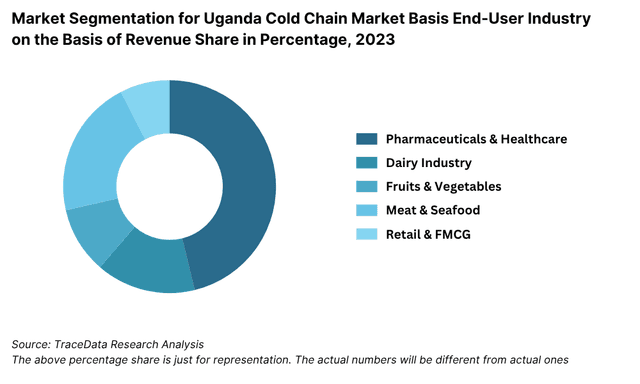
By End-User Industry: The pharmaceutical industry leads Uganda’s cold chain demand, particularly for vaccines, biologics, and temperature-sensitive medicines. This segment has seen consistent growth due to expanded immunization programs and donor-funded vaccine procurement. The dairy industry follows closely, owing to Uganda’s robust milk production and the need for chilled storage across collection and distribution points. Fruits & vegetables and meat & seafood also form critical demand segments, driven by the push for reducing post-harvest losses and meeting export quality standards.
By Temperature Type: Frozen segment holds the majority share, driven by the storage needs of meat, fish, and frozen pharmaceutical products such as certain vaccines and biologicals. Chilled segment, while smaller, is gaining traction in dairy, fresh produce, and short-haul transport of fresh meat and juices. Urban demand for fresh refrigerated foods and beverages has accelerated investments in chilled logistics, especially by modern retail players.
Competitive Landscape in Uganda Cold Chain Market
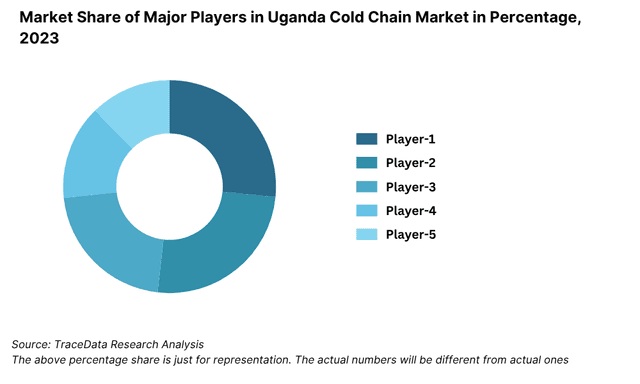
The Uganda cold chain market is moderately fragmented, with a mix of established logistics firms, specialized cold storage providers, and donor-backed ventures. While a few key players dominate cold storage capacities in Kampala and Entebbe, the entry of solar-powered storage startups and agri-logistics innovators has diversified the competitive landscape in recent years. Companies like Freight in Time, Movit Products, Farmgain Africa, KK Fresh Produce Exporters, and Rocket Health are playing vital roles in cold chain development across various sectors including food, pharma, and exports.
Company | Establishment Year | Headquarters |
Freight in Time | 2001 | Kampala, Uganda |
Movit Products | 1997 | Kampala, Uganda |
Farmgain Africa | 2004 | Kampala, Uganda |
KK Fresh Produce Exporters | 1995 | Entebbe, Uganda |
Rocket Health | 2012 | Kampala, Uganda |
Some of the recent competitor trends and key information about competitors include:
Freight in Time: A regional logistics leader with specialized cold chain solutions for pharmaceuticals and perishables, Freight in Time opened a 1,200 sqm cold storage hub in Kampala in 2023. The facility supports temperature-sensitive medical supplies and is equipped with IoT-enabled temperature monitoring systems. The company has also expanded cold transport offerings along the Northern Corridor.
Movit Products: Primarily known for its cosmetics and healthcare goods, Movit Products has integrated in-house cold storage to preserve sensitive inputs and final products. In 2023, the company invested in energy-efficient chillers and expanded its storage footprint to support anticipated export growth across East Africa.
Farmgain Africa: This agri-tech enterprise operates cold storage aggregation centers in central and western Uganda to support smallholder farmers in reducing post-harvest losses. With support from development agencies, Farmgain installed over 10 solar-powered cold rooms in rural agricultural belts in 2023, directly benefiting horticulture producers.
KK Fresh Produce Exporters: A leading player in Uganda’s fresh produce export segment, KK Fresh owns and operates refrigerated pack houses near Entebbe Airport. The company exported over 8,000 tons of fresh produce in 2023, with 100% of shipments handled through integrated cold chain logistics to meet EU quality standards.
Rocket Health: This telehealth and diagnostics company has developed a temperature-controlled sample collection and transport system. In 2023, Rocket Health scaled up its diagnostic logistics operations in Kampala, ensuring cold chain integrity for blood, vaccine, and laboratory sample transport across over 30 health facilities.
What Lies Ahead for Uganda Cold Chain Market?
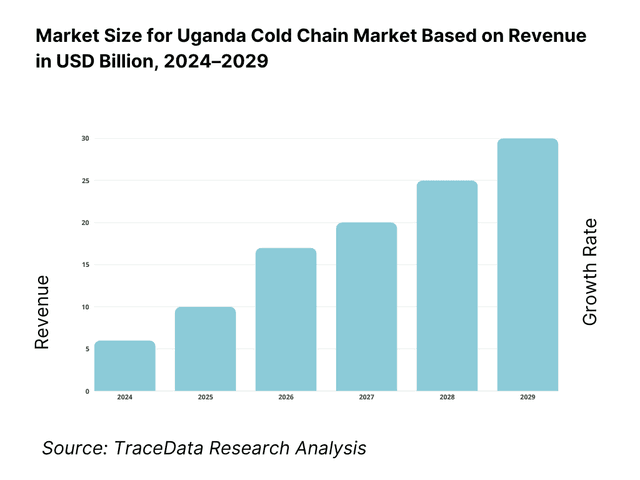
The Uganda cold chain market is projected to witness steady growth through 2029, supported by rising demand from the pharmaceutical, agricultural export, and retail sectors. The market is expected to expand at a moderate CAGR over the forecast period, driven by infrastructure investments, government and donor-led programs, and increased private sector participation.
Expansion of Solar-Powered Cold Storage: With continued focus on rural electrification challenges, the adoption of solar-powered cold rooms is expected to increase, especially in agricultural belts. These sustainable solutions offer reliable storage for perishable goods and are being increasingly funded by NGOs and agritech players. By 2029, solar cold storage units are projected to account for over 30% of newly added capacity in rural Uganda.
Integration of Digital Monitoring Systems: The cold chain industry in Uganda is likely to see greater integration of IoT-enabled sensors, GPS tracking, and real-time temperature logging. These systems will enhance supply chain visibility, reduce product spoilage, and improve compliance with international standards—especially in pharma and food exports. Digital platforms will also help logistics providers better track vehicle routes, fuel usage, and equipment performance.
Growth of Export-Oriented Cold Chain Infrastructure: Uganda’s ambition to boost its horticultural, fishery, and dairy exports will require scalable and reliable cold chain solutions. Exporters are expected to invest in temperature-controlled pack houses and bonded cold warehouses near Entebbe and major highways. This will be further supported by trade agreements with the EU, UK, and Middle East markets, which mandate stringent cold chain compliance.
Rise in Public-Private Partnerships (PPP): The government is likely to increase its reliance on PPP models to accelerate cold chain infrastructure development. Through co-investment mechanisms under programs like the Agriculture Cluster Development Project (ACDP), and future donor-backed initiatives, several new regional cold storage hubs are expected to be commissioned by 2029.
Uganda Cold Chain Market Segmentation
• By Market Structure:
o Cold Storage Facilities
o Cold Transportation Services (Refrigerated Trucks, Containers)
o Organized Cold Chain Operators
o Unorganized/Informal Logistics Providers
o Solar-Powered Cold Rooms
o Government and Donor-Funded Infrastructure
• By End-User Industry:
o Pharmaceuticals (Vaccines, Biologics)
o Dairy (Milk, Cheese, Yogurt)
o Meat & Seafood (Beef, Chicken, Fish)
o Fruits & Vegetables (Avocado, Banana, Pineapple, Mango)
o Foodservice & Retail (Hotels, Restaurants, Supermarkets)
o Diagnostics and Laboratory Samples
o Export-Oriented Agribusinesses
• By Temperature Type:
o Chilled (0°C to 8°C)
o Frozen (-18°C and below)
o Deep-Frozen/Ultra-Low (-70°C for specialized pharma)
• By Region:
o Central (Kampala, Wakiso)
o Western (Mbarara, Fort Portal)
o Northern (Gulu, Lira)
o Eastern (Mbale, Soroti)
o West Nile (Arua, Nebbi)
o Lake Victoria Corridor (Entebbe, Jinja)
Players Mentioned in the Report:
• Freight in Time
• Movit Products
• Farmgain Africa
• KK Fresh Produce Exporters
• Rocket Health
• Pearl Dairy
• Uganda National Medical Stores
• Sanlam General Insurance (cold chain cargo insurance support)
• SolarNow Uganda
• HortiFresh Cold Storage Ltd
Key Target Audience:
• Cold Chain Logistics Operators
• Food and Agri Exporters
• Pharmaceutical Distributors and Manufacturers
• Government Ministries (e.g., Ministry of Agriculture, Health)
• Development Agencies (e.g., USAID, GIZ, FAO, World Bank)
• Cold Storage Equipment Manufacturers and Suppliers
• Retail Chains and Supermarkets
• Dairy and Meat Processing Companies
• Health NGOs and Vaccine Programs
• Investment Promotion Agencies
Time Period:
• Historical Period: 2018–2023
• Base Year: 2024
• Forecast Period: 2024–2029
See What's Inside the Report
Get a preview of key findings, methodology and report coverage
Table of Contents
1. Executive Summary
2. Research Methodology
3. Ecosystem of Key Stakeholders in Uganda Cold Chain Market
4. Value Chain Analysis
4.1. Value Chain Process-Role of Entities, Stakeholders, and Challenges They Face
4.2. Revenue Streams for Uganda Cold Chain Market
4.3. Business Model Canvas for Uganda Cold Chain Market
4.4. Procurement and Logistics Decision-Making Process
4.5. End-User Demand Decision-Making Process
5. Market Structure
5.1. Cold Storage and Cold Transport Capacity in Uganda, 2018-2024
5.2. Domestic Production vs. Export-Oriented Demand, 2018-2024
5.3. Cold Chain Infrastructure by Region in Uganda, 2024
5.4. Number of Cold Chain Operators in Uganda by Type and Size
6. Market Attractiveness for Uganda Cold Chain Market
7. Supply-Demand Gap Analysis
8. Market Size for Uganda Cold Chain Market Basis
8.1. Revenues, 2018-2024
8.2. Cold Chain Capacity (MT/CBM), 2018-2024
9. Market Breakdown for Uganda Cold Chain Market Basis
9.1. By Market Structure (Organized vs. Unorganized), 2023-2024P
9.2. By End-User Industry (Pharma, Dairy, Fruits & Vegetables, Meat & Seafood, Retail), 2023-2024P
9.3. By Temperature Type (Chilled and Frozen), 2023-2024P
9.4. By Region (Central, Western, Northern, Eastern, West Nile, Lake Victoria Corridor), 2023-2024P
9.5. By Type of Cold Storage (Static, Solar-Powered, Mobile), 2023-2024P
9.6. By Type of Transport (Reefer Trucks, Reefer Containers, Motorbikes), 2023-2024P
10. Demand Side Analysis for Uganda Cold Chain Market
10.1. Customer Landscape and Segmentation
10.2. End-User Journey and Decision-Making
10.3. Needs, Desires, and Pain Point Analysis
10.4. Demand-Supply Gap Framework
11. Industry Analysis
11.1. Trends and Developments in Uganda Cold Chain Market
11.2. Growth Drivers for Uganda Cold Chain Market
11.3. SWOT Analysis
11.4. Issues and Challenges
11.5. Government Policies and Donor Initiatives Impacting Cold Chain
12. Snapshot on Solar Cold Chain Storage in Uganda
12.1. Installed Capacity and Future Potential, 2018-2029
12.2. Business Models and Funding Approaches
12.3. Cross Comparison of Key Solar Cold Chain Providers
13. Cold Chain Logistics Financing Ecosystem in Uganda
13.1. Financing Penetration for Cold Chain Infrastructure
13.2. Donor-Backed Programs and PPPs
13.3. Private Sector Investment Flow and Risk Appetite
13.4. Role of Impact Investors and Development Finance Institutions (DFIs)
14. Opportunity Matrix for Uganda Cold Chain Market-Presented Using Radar Chart
15. PEAK Matrix Analysis for Uganda Cold Chain Market
16. Competitor Analysis for Uganda Cold Chain Market
16.1. Benchmark of Key Competitors Including Overview, Service Portfolio, Strength, Weakness, Geographic Focus, Cold Storage Capacity, Transport Fleet, Pricing Model
16.2. Strength and Weakness Matrix
16.3. Operating Model Comparison Framework
16.4. Strategic Positioning-Gartner Magic Quadrant Style Grid
16.5. Bowman’s Strategic Clock for Competitive Advantage
17. Future Market Size for Uganda Cold Chain Market Basis
17.1. Revenues, 2025-2029
17.2. Cold Chain Capacity Expansion (MT/CBM), 2025-2029
18. Market Breakdown for Uganda Cold Chain Market Basis
18.1. By Market Structure, 2025-2029
18.2. By End-User Industry, 2025-2029
18.3. By Temperature Type, 2025-2029
18.4. By Region, 2025-2029
18.5. By Storage and Transport Sub-Type, 2025-2029
18.6. Opportunity Analysis and Risk Scenarios
18.7. Recommendations for Investors and Policy Makers
Discuss a Customized Research Scope
Custom research scope • Tailored insights • Industry expertise
Research Methodology
Step 1: Ecosystem Creation
Map the ecosystem and identify all demand-side and supply-side entities relevant to the Uganda Cold Chain Market. This includes stakeholders across cold storage operators, refrigerated transport providers, agriculture exporters, pharmaceutical distributors, retail chains, development organizations, and government bodies.
Sourcing is done through a combination of industry reports, donor agency publications (e.g., USAID, FAO), cold chain project documents, press releases, and multiple secondary and proprietary databases to create a robust desk research base around market dynamics, key players, and infrastructure capacity.
Step 2: Desk Research
Subsequently, we engage in an exhaustive desk research process by referencing diverse secondary and proprietary databases. This approach enables us to conduct a thorough analysis of the cold chain industry in Uganda, covering aspects such as infrastructure investments, public-private partnerships, storage and transport capacity, power availability, perishables demand patterns, and sector-specific trends.
We supplement this with detailed examinations of company-level data, relying on sources such as company websites, annual reports (where available), donor project documents, public tenders, and infrastructure development plans. This process forms the foundational understanding of market structure and stakeholder roles.
Step 3: Primary Research
We initiate a series of in-depth interviews with C-level executives, logistics managers, and project heads representing cold chain logistics firms, agri-exporters, pharmaceutical distributors, and infrastructure planners. The objective is to validate hypotheses, confirm market structure and dynamics, and gain insights into market size, pricing, utilization rates, and operational models.
As part of our validation strategy, our team conducts disguised interviews posing as potential clients or collaborators. These interactions enable triangulation of information obtained from formal interviews and public sources, providing critical inputs on pricing, equipment costs, regional gaps, and usage patterns across different cold chain segments.
Step 4: Sanity Check
Bottom-up and top-down estimation models are used to triangulate the market size. Cold storage and refrigerated transport capacities are evaluated regionally, then aggregated to estimate market revenues. These are cross-validated against volume requirements for perishable products (milk, fish, fruits, vaccines), pricing benchmarks, and donor funding flows. A multi-layered modeling approach ensures the robustness and reliability of final figures.
See What's Inside the Report
Get a preview of key findings, methodology and report coverage
Frequently Asked Questions
The Uganda cold chain market holds significant growth potential, with an estimated valuation of UGX 400 Billion in 2023. Its expansion is being driven by rising demand in sectors such as pharmaceuticals, dairy, fresh produce, and meat exports. The market is also benefiting from donor-backed infrastructure programs, public-private partnerships, and increasing adoption of solar-powered cold storage solutions in rural areas. As Uganda strengthens its export capacity and food security measures, the cold chain sector is expected to expand steadily through 2029.
Key players in the Uganda Cold Chain Market include Freight in Time, Movit Products, Farmgain Africa, KK Fresh Produce Exporters, and Rocket Health. These companies are active across cold storage, refrigerated transport, and temperature-controlled medical logistics. Other important stakeholders include Pearl Dairy, National Medical Stores, and renewable energy cold storage providers such as SolarNow Uganda.
Primary growth drivers include increasing demand for safe vaccine and pharmaceutical distribution, rising fresh food exports (especially horticulture and fish), government-backed agricultural development programs, and modernization in the retail and foodservice sectors. Additionally, the need to reduce post-harvest losses—currently estimated at 30–40% for perishables—is prompting greater investments in reliable cold chain infrastructure.
The market faces multiple challenges, including unreliable electricity supply, limited cold storage infrastructure in rural areas, high operating costs (particularly due to fuel reliance), and a shortage of skilled technicians. Furthermore, logistical bottlenecks and inadequate cold transport options hinder last-mile delivery, contributing to product spoilage and inefficiencies in the supply chain.
License Options
PDF + Excel
Complete report package
$4,000
Excel Only
Data and analytics
$2,500