United States Auto Finance Market Outlook to 2029
By Market Structure, By Lenders, By Vehicle Type, By Loan Tenure, By Credit Score, and By Region
Report Overview
Report Code
TDR0162
Coverage
North America
Published
May 2025
Pages
80
Flexible Purchase Options
Select and purchase only the chapters you need for your strategic decisions
On This Page
Report Overview
The report titled “United States Auto Finance Market Outlook to 2029 – By Market Structure, By Lenders, By Vehicle Type, By Loan Tenure, By Credit Score, and By Region” provides a comprehensive analysis of the auto finance market in the U.S. It encompasses the industry's evolution and current landscape, market size by outstanding loans and credit disbursed, detailed segmentation, emerging trends, regulatory dynamics, consumer profiling, key challenges, and competitive benchmarking including cross-comparisons and profiles of leading players. The report concludes with future market forecasts based on macroeconomic indicators, policy shifts, and case studies that identify success factors and market constraints.
Report Coverage
Verified Market Sizing
Multi-layer forecasting with historical data and 5–10 year outlook
Deep-Dive Segmentation
Cross-sectional analysis by product type, end user, application and region
Competitive Benchmarking & Positioning
Market share, operating model, pricing and competition matrices
Actionable Insights & Risk Assessment
High-growth white spaces, underserved segments, technology disruptions and demand inflection points
Review Methodology & Data Structure
Preview report structure, data sources and research framework
Executive Summary
The report titled “United States Auto Finance Market Outlook to 2029 – By Market Structure, By Lenders, By Vehicle Type, By Loan Tenure, By Credit Score, and By Region” provides a comprehensive analysis of the auto finance market in the U.S. It encompasses the industry's evolution and current landscape, market size by outstanding loans and credit disbursed, detailed segmentation, emerging trends, regulatory dynamics, consumer profiling, key challenges, and competitive benchmarking including cross-comparisons and profiles of leading players. The report concludes with future market forecasts based on macroeconomic indicators, policy shifts, and case studies that identify success factors and market constraints.
United States Auto Finance Market Overview and Size
The United States auto finance market reached a valuation of USD 1.6 Trillion in outstanding auto loans in 2023, supported by a stable interest rate environment, increasing vehicle prices, and growing consumer reliance on financing for both new and used car purchases. The market is dominated by major players such as Ally Financial, Capital One Auto Finance, Wells Fargo Auto, Toyota Financial Services, and Ford Credit, who have built expansive dealer networks and offer tailored loan and lease programs across diverse customer segments.
In 2023, digital financing platforms such as Carvana and AutoFi further strengthened their foothold in the market by offering instant approvals and AI-powered credit assessments. States such as California, Texas, and Florida emerged as key markets due to their high population, vehicle density, and regional economic strength.
Market Size for US Auto Finance Industry on the Basis of Credit Disbursed in USD Billion, 2018-2023

What Factors are Leading to the Growth of the United States Auto Finance Market:
High Vehicle Prices: Rising prices of new and used vehicles—up by 20-30% post-pandemic—have pushed more buyers towards financing. In 2023, over 85% of new car purchases and 55% of used car purchases were financed through loans or lease programs.
Favorable Credit Availability: Low delinquency rates and a recovering labor market encouraged lenders to expand credit offerings. Additionally, lenders introduced flexible repayment models to attract a broader customer base.
Used Vehicle Financing Surge: With the used car market growing significantly, financing for used vehicles saw a CAGR of over 7% from 2018–2023. Players like Credit Acceptance and Santander Consumer USA have specialized in subprime and near-prime segments to capture this growth.
Which Industry Challenges Have Impacted the Growth for United States Auto Finance Market
High Interest Rate Volatility: One of the most significant challenges has been the fluctuation in interest rates, especially following the Federal Reserve’s aggressive rate hikes in 2022–2023. Auto loan interest rates rose from an average of 4.2% in 2021 to nearly 7.1% in 2023 for new vehicles, significantly increasing the cost of financing. As per industry insights, this caused nearly 18% of potential borrowers to delay or cancel planned vehicle purchases due to affordability concerns.
Rising Delinquency Rates Among Subprime Borrowers: There has been a steady increase in auto loan delinquencies, particularly in the subprime segment. In 2023, delinquencies on subprime auto loans hit 5.6%, the highest level in over a decade. This has led to tighter underwriting standards and reduced loan approvals among riskier consumer segments, which in turn has slowed market expansion.
Decline in Vehicle Affordability: Due to inflation and supply chain disruptions, the average price of new vehicles in the U.S. crossed USD 48,000 in 2023, making affordability a significant concern. Coupled with rising loan rates, the average monthly auto loan payment reached USD 738, pricing out a segment of middle-income buyers and reducing financing volumes.
What are the Regulations and Initiatives which have Governed the Market
Consumer Financial Protection Bureau (CFPB) Oversight: The CFPB regulates auto lenders to ensure fair lending, transparency, and consumer rights protection. In 2023, the bureau tightened rules around loan disclosures and prepayment penalties, improving borrower transparency but increasing administrative costs for lenders.
State-Level Usury Caps and Licensing: Various states impose interest rate caps and licensing requirements for auto lenders. For instance, California enforces a maximum interest rate of 36% APR on auto loans under certain lending thresholds. These regional disparities have created operational complexity for national lenders.
Federal EV Tax Credits and Financing Programs: To support electric vehicle adoption, the Inflation Reduction Act of 2022 extended federal tax credits of up to USD 7,500 for qualifying EVs. This has indirectly boosted EV financing demand, as banks and captives offer special loan terms for electric vehicles to capitalize on this shift.
United States Auto Finance Market Segmentation
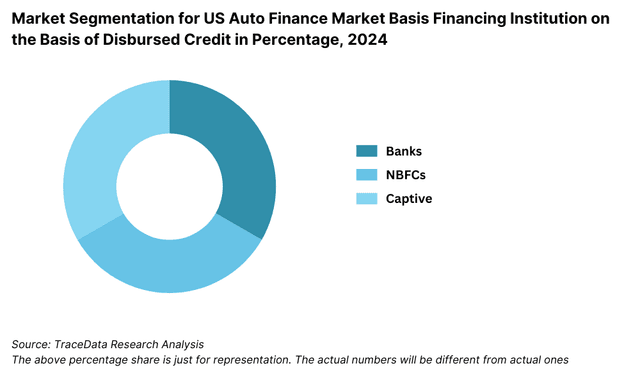
By Market Structure: Bank-Owned Lenders dominate the U.S. auto finance landscape, benefiting from their widespread reach, lower cost of funds, and trust built over decades. These institutions often offer competitive interest rates, flexible repayment terms, and bundled financial products, making them the preferred choice for prime borrowers. Captive Finance Companies such as Ford Credit, GM Financial, and Toyota Financial Services hold a significant market share, particularly for new vehicle financing, due to close integration with OEMs and promotional 0% or low-interest loan offers. Non-Banking Financial Institutions (NBFIs) and Digital Lenders have carved out strong positions in subprime and near-prime segments by offering tailored products, faster processing times, and higher approval flexibility.
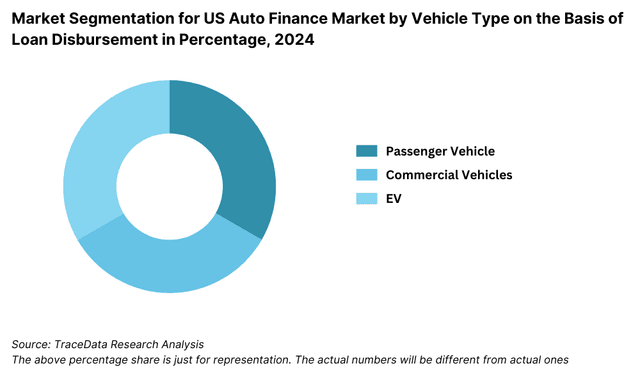
By Vehicle Type: New Car Financing leads in terms of loan value disbursed, particularly due to high average ticket size and OEM-led promotional offers. However, growth in Used Car Financing is outpacing new cars, driven by rising affordability concerns and the growing certified pre-owned market. In 2023, used vehicle financing accounted for over 40% of total auto loan originations in volume terms.
By Credit Score Tier: Prime and Super Prime borrowers dominate the loan market due to their strong credit profiles and lower risk levels. Lenders offer them the best terms, including lower interest rates and longer tenures.
The Subprime segment—representing borrowers with FICO scores under 620—faces higher interest rates and tighter approval standards. Still, this segment is crucial for NBFCs and digital lenders focusing on high-margin loans.
Competitive Landscape in United States Auto Finance Market
The U.S. auto finance market is a mature and competitive space with a mix of traditional banks, captive finance arms of OEMs, and non-bank financial institutions including fintech lenders. While established banks and captives dominate a significant portion of the market, the entry of digital-first lenders and auto financing platforms has brought innovation and disruption in credit underwriting, loan disbursal, and customer experience.
| Company Name | Founding Year | Original Headquarters |
| Ally Financial | 1919 | Detroit, Michigan |
| Capital One Auto Finance | 1994 | McLean, Virginia |
| GM Financial | 1992 | Fort Worth, Texas |
| Wells Fargo Auto | 1929 | San Francisco, California |
| Chase Auto | 2000 | New York City, New York |
| Credit Acceptance Corporation | 1972 | Southfield, Michigan |
| DriveTime | 2002 | Tempe, Arizona |
| Consumer Portfolio Services | 1991 | Irvine, California |
| Santander Consumer USA | 1995 | Dallas, Texas |
| Toyota Financial Services | 1983 | Torrance, California |
Some of the recent competitor trends and key information about leading players include:
Ally Financial: One of the largest auto lenders in the U.S., Ally Financial originated over USD 45 billion in auto loans in 2023. The company continues to focus on expanding its digital loan services and recently launched an AI-based decision engine to improve approval speed and accuracy.
Capital One Auto Finance: Known for its pre-qualification and soft credit pull tools, Capital One Auto has leveraged online platforms to simplify the auto loan process. In 2023, it experienced a 17% YoY increase in digital loan applications, driven by growing demand for contactless financing options.
Wells Fargo Auto: Despite pulling back from certain subprime lending practices, Wells Fargo Auto remains a major player in the prime segment. The company disbursed around USD 27 billion in auto loans in 2023 and has increased collaboration with dealerships through enhanced point-of-sale financing programs.
Toyota Financial Services: TFS holds a leading position in captive financing for Toyota and Lexus vehicles. In 2023, over 75% of Toyota new vehicle sales in the U.S. were financed through TFS, driven by competitive APR offers and lease specials.
Ford Credit: With strong integration into Ford’s dealership network, Ford Credit financed over 60% of new Ford vehicle sales in 2023. The company continues to lead in loyalty financing, with high renewal rates for returning customers.
What Lies Ahead for United States Auto Finance Market?
The United States auto finance market is projected to witness stable growth through 2029, supported by a combination of macroeconomic recovery, vehicle electrification, evolving consumer financing behavior, and digital innovation. The market is expected to register a moderate CAGR over the forecast period, with used vehicle financing and digital lending platforms playing a pivotal role in market expansion.
Expansion of Used Vehicle Financing: With continued pressure on new vehicle affordability and rising consumer demand for cost-effective transportation, the used vehicle financing segment is expected to grow faster than new vehicle loans. Lenders will increasingly target this segment with tailored products, flexible tenures, and tech-enabled credit assessments.
Rising Influence of EV Financing: The growing penetration of electric vehicles (EVs), fueled by federal incentives and stricter emission norms, is expected to alter financing dynamics. Lenders are beginning to offer EV-specific loan programs, including battery health warranties and resale value-based EMIs, to address consumer hesitations around EV ownership.
Technology-Led Underwriting and Credit Decisioning: AI, machine learning, and alternative data models will continue to transform how credit risk is assessed. By 2029, a significant portion of auto loans—especially in the near-prime and subprime segments—are expected to be underwritten using non-traditional credit scoring models that improve access to credit for underserved consumers.
Embedded Finance and Dealership Digitalization: Auto financing will become more integrated within the digital vehicle purchase journey. Online auto retailers, OEMs, and fintechs will offer embedded financing solutions directly on digital platforms—enabling consumers to compare offers, receive approvals, and complete transactions without visiting a bank or branch.
United States Auto Finance Market Segmentation
- By Market Structure:
o Bank-Owned Lenders
o Captive Finance Companies
o Non-Banking Financial Companies (NBFCs)
o Fintech Auto Lending Platforms
o Credit Unions
o Peer-to-Peer Auto Loan Platforms - By Vehicle Type:
o New Vehicles
o Used Vehicles
o Electric Vehicles (EVs)
o Commercial Vehicles - By Loan Tenure:
o Less than 36 Months
o 36–48 Months
o 49–60 Months
o 61–72 Months
o More than 72 Months - By Credit Score Tier:
o Super Prime (720+)
o Prime (660–719)
o Near Prime (620–659)
o Subprime (<620) - By Financing Type:
o Auto Loans
o Auto Leasing
o Dealer Financing
o Direct-to-Consumer Financing - By Region:
o Northeast
o Midwest
o South
o West
Players Mentioned in the Report (Banks):
- Bank of America
- Capital One
- Chase Auto (JPMorgan Chase)
- PNC Bank
- U.S. Bank
- Wells Fargo
- Truist Bank
- Huntington National Bank
Players Mentioned in the Report (NBFCs):
- Ally Financial
- Santander Consumer USA
- Westlake Financial Services
- Exeter Finance
- CarMax Auto Finance
- Credit Acceptance
- DriveTime / Bridgecrest
- Flagship Credit Acceptance
- First Help Financial
- Global Lending Services
- Prestige Financial Services
- United Auto Credit
- Tidewater Finance Company
- Skopos Financial
- OpenRoad Lending
Players Mentioned in the Report (Captive):
- Ford Motor Credit Company
- GM Financial
- Toyota Financial Services
- American Honda Finance Corporation
- Nissan Motor Acceptance Corporation
- Hyundai Capital America
- Mercedes-Benz Financial Services USA
- BMW Financial Services NA
- Volkswagen Credit
- Volvo Car Financial Services USA
- Porsche Financial Services
- Harley-Davidson Financial Services
- Maserati Capital USA
- Subaru Motors Finance
- Southeast Toyota Finance
Key Target Audience:
- Auto Finance Providers (Banks, Captives, NBFCs)
- Online Auto Retailers and Fintech Lenders
- Vehicle Dealership Chains
- Automotive OEMs
- Regulatory Bodies (e.g., CFPB, FTC, Federal Reserve)
- Data Analytics & Credit Scoring Agencies
- Investment Firms & Financial Analysts
Time Period:
- Historical Period: 2018–2023
- Base Year: 2024
- Forecast Period: 2024–2029
Explore Flexible Purchase Options or Have Limited Budget?
Pay only for relevant chapters • Customizable report sections
Table of Contents
Choose individual sections to purchase. Mix and match as you like.
4.1. Value Chain Process-Role of Entities, Stakeholders, and challenges they face.
4.2. Relationship and Engagement Model between Banks-Dealers, NBFCs-Dealers and Captive-Dealers-Commission Sharing Model, Flat Fee Model and Revenue streams
5.1. New Car and Used Car Sales in US by type of vehicle, 2018-2024
8.1. Credit Disbursed, 2018-2024
8.2. Outstanding Loan, 2018-2024
9.1. By Market Structure (Bank-Owned, Multi-Finance, and Captive Companies), 2023-2024
9.2. By Vehicle Type (Passenger, Commercial and EV), 2023-2024
9.3. By Region, 2023-2024
9.4. By Type of Vehicle (New and Used), 2023-2024
9.5. By Average Loan Tenure (0-2 years, 3-5 years, 6-8 years, above 8 years), 2023-2024
10.1. Customer Landscape and Cohort Analysis
10.2. Customer Journey and Decision-Making
10.3. Need, Desire, and Pain Point Analysis
10.4. Gap Analysis Framework
11.1. Trends and Developments for US Car Finance Market
11.2. Growth Drivers for US Car Finance Market
11.3. SWOT Analysis for US Car Finance Market
11.4. Issues and Challenges for US Car Finance Market
11.5. Government Regulations for US Car Finance Market
12.1. Market Size and Future Potential for Online Car Financing Aggregators, 2018-2029
12.2. Business Model and Revenue Streams
12.3. Cross Comparison of Leading Digital Car Finance Companies Based on Company Overview, Revenue Streams, Loan Disbursements/Number of Leads Generated, Operating Cities, Number of Branches, and Other Variables
13.1. Finance Penetration Rate and Average Down Payment for New and Used Cars, 2018-2029
13.2. How Finance Penetration Rates are Changing Over the Years with Reasons
13.3. Type of Car Segment for which Finance Penetration is Higher
17.1. Market Share of Key Banks in US Car Finance Market, 2024
17.2. Market Share of Key NBFCs in US Car Finance Market, 2024
17.3. Market Share of Key Captive in US Car Finance Market, 2024
17.4. Benchmark of Key Competitors in US Car Finance Market, including Variables such as Company Overview, USP, Business Strategies, Strengths, Weaknesses, Business Model, Number of Branches, Product Features, Interest Rate, NPA, Loan Disbursed, Outstanding Loans, Tie-Ups and others
17.5. Strengths and Weaknesses
17.6. Operating Model Analysis Framework
17.7. Gartner Magic Quadrant
17.8. Bowmans Strategic Clock for Competitive Advantage
18.1. Credit Disbursed, 2025-2029
18.2. Outstanding Loan, 2025-2029
19.1. By Market Structure (Bank-Owned, Multi-Finance, and Captive Companies), 2025-2029
19.2. By Vehicle Type (Passenger, Commercial and EV), 2025-2029
19.3. By Region, 2025-2029
19.4. By Type of Vehicle (New and Used), 2025-2029
19.5. By Average Loan Tenure (0-2 years, 3-5 years, 6-8 years, above 8 years), 2025-2029
19.6. Recommendations
19.7. Opportunity Analysis
Discuss a Customized Research Scope
Custom research scope • Tailored insights • Industry expertise
Research Methodology
Step 1: Ecosystem Creation
Map the ecosystem and identify all demand-side and supply-side entities in the United States Auto Finance Market. On the demand side, this includes individual consumers, dealerships, and fleet operators seeking vehicle loans or leases. On the supply side, we include banks, captive finance arms of OEMs, NBFCs, fintech lenders, and credit unions.
Based on this ecosystem, we shortlist leading 5–6 players in each lender category using metrics such as outstanding auto loan portfolio, disbursement volume, borrower segmentation, and digital presence.
Sourcing is done through industry publications, regulatory filings (e.g., CFPB, Federal Reserve), proprietary financial databases, lender annual reports, and automotive associations to consolidate initial secondary insights.
Step 2: Desk Research
An exhaustive desk research phase is conducted by leveraging a wide range of secondary and proprietary databases. This includes analysis of data from the Federal Reserve Bank, Experian Auto Finance Reports, Statista, company websites, and press releases.
The research focuses on gathering data points such as market size (outstanding loans, credit disbursed), lender market shares, consumer behavior trends, interest rate patterns, regional financing data, and credit tier segmentation.
Detailed company-level information is reviewed using public filings (10-Ks, earnings calls), market intelligence platforms, and industry commentaries to construct a foundational understanding of the operational models, risk profiles, and digital transformation strategies of major players.
Step 3: Primary Research
A structured round of in-depth interviews is conducted with C-level executives, strategy heads, and regional heads of leading banks, captives, fintech auto lenders, and dealership financing divisions.
Interviews are designed to validate secondary hypotheses, estimate real-time market shifts, and uncover lender-side strategies related to digital loan origination, subprime risk management, EV financing, and regulatory compliance.
Bottom-up analysis is undertaken to calculate total auto loan disbursements across lender types and vehicle segments. These are then aggregated to form a comprehensive national-level market size.
As part of our triangulation and validation framework, disguised interviews are conducted with frontline loan agents and auto dealership finance managers, providing insights into pricing flexibility, commission models, borrower qualification criteria, and repayment behavior patterns.
Step 4: Sanity Check
A combination of bottom-up and top-down market modeling exercises are performed to validate the robustness of estimates. This includes triangulating insights from secondary research, lender interviews, credit bureau data, and macroeconomic indicators such as vehicle sales trends, average APRs, and household debt-to-income ratios.
The market sizing exercise is aligned with both historical benchmarks and future projections under conservative, base-case, and aggressive growth scenarios.
See What's Inside the Report
Get a preview of key findings, methodology and report coverage
Frequently Asked Questions
The United States Auto Finance Market reached an estimated USD 1.6 trillion in outstanding auto loans in 2023 and is projected to grow steadily through 2029. This growth is driven by rising vehicle prices, increasing reliance on financing for both new and used car purchases, and the expansion of digital lending platforms. The market’s future potential is further enhanced by the shift toward electric vehicle financing and innovations in AI-powered credit decisioning.
Key players include Ally Financial, Capital One Auto Finance, Wells Fargo Auto, Toyota Financial Services, Ford Credit, and Santander Consumer USA. In addition, digital lenders such as Carvana and Upstart Auto Retail are gaining momentum by offering fast, fully digital loan application processes. These companies maintain strong dealership partnerships, competitive financing packages, and specialized offerings for different credit tiers.
Major growth drivers include increasing vehicle costs, which have made financing a necessity for most buyers; greater penetration of digital platforms that streamline loan processing and improve customer experience; and regulatory incentives for EVs, which are spurring the creation of new financing models. Additionally, growing adoption of AI and alternative credit scoring systems is helping lenders reach underserved customer segments.
Key challenges include interest rate volatility, which has raised monthly payments and affected loan affordability, and rising delinquency rates in the subprime segment, leading to tighter underwriting standards. Furthermore, regulatory scrutiny around fair lending practices, repossession protocols, and data privacy has increased operational complexity for lenders. Lastly, affordability concerns due to high vehicle prices remain a structural challenge for both lenders and borrowers.
License Options
PDF + Excel
Complete report package
$4,000
Excel Only
Data and analytics
$2,500
Custom Sections
Starts from $100
$0