US Automotive Wiring Harness Market Outlook to 2030
By Vehicle Type, By Powertrain, By Application/Circuit Domain, By Voltage Class, By Harness Type, By Conductor Material, and By Manufacturing Footprint
Report Overview
Report Code
TDR0397
Coverage
North America
Published
December 2025
Pages
80
Flexible Purchase Options
Select and purchase only the chapters you need for your strategic decisions
On This Page
Report Overview
The report titled “US Automotive Wiring Harness Market Outlook to 2030 – By Vehicle Type, By Powertrain, By Application/Circuit Domain, By Voltage Class, By Harness Type, By Conductor Material, and By Manufacturing Footprint” provides a comprehensive analysis of the automotive wiring harness industry in the United States. The report covers an overview and genesis of the industry, overall market size in terms of revenue, market segmentation; trends and developments, regulatory landscape, customer level profiling, issues and challenges, and competitive landscape including competition scenario, cross-comparison, opportunities and bottlenecks, and company profiling of major players in the automotive wiring harness market.
Report Coverage
Verified Market Sizing
Multi-layer forecasting with historical data and 5–10 year outlook
Deep-Dive Segmentation
Cross-sectional analysis by product type, end user, application and region
Competitive Benchmarking & Positioning
Market share, operating model, pricing and competition matrices
Actionable Insights & Risk Assessment
High-growth white spaces, underserved segments, technology disruptions and demand inflection points
Review Methodology & Data Structure
Preview report structure, data sources and research framework
Executive Summary
The report titled “US Automotive Wiring Harness Market Outlook to 2030 – By Vehicle Type, By Powertrain, By Application/Circuit Domain, By Voltage Class, By Harness Type, By Conductor Material, and By Manufacturing Footprint” provides a comprehensive analysis of the automotive wiring harness industry in the United States. The report covers an overview and genesis of the industry, overall market size in terms of revenue, market segmentation; trends and developments, regulatory landscape, customer level profiling, issues and challenges, and competitive landscape including competition scenario, cross-comparison, opportunities and bottlenecks, and company profiling of major players in the automotive wiring harness market. The report concludes with future market projections based on vehicle volumes, high-voltage product penetration, manufacturing footprints, cause-and-effect relationships, and success case studies highlighting the major opportunities and cautions.
US Automotive Wiring Harness Market Overview and Size
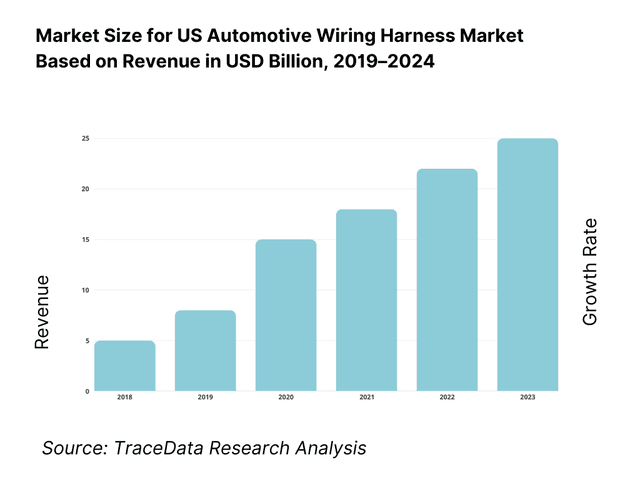
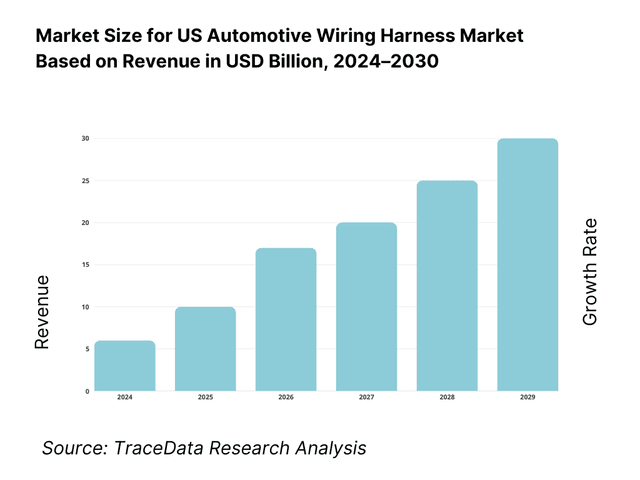
The US automotive wiring harness market is valued at USD 6,575.5 million, based on a five-year historical analysis, which tracks country-level revenues and segment splits. Demand is anchored by vehicle builds and electronics content per vehicle; new-vehicle sales closed at 15.5 million units and industry forecasters held a 15.7 million sales outlook for the following cycle, sustaining line-fit harness volumes and service parts pull. Content growth from ADAS, infotainment and electrification—particularly high-voltage orange harnesses—continues to support value per vehicle.
The national hub is concentrated around vehicle assembly corridors in the Great Lakes, Southeast, and US–Mexico border states because of co-location with OEMs, access to engineering talent, and short cross-border lanes into Mexican harness plants under USMCA. Recent public financing of USD 362 million to CelLink for a Texas plant underscores the shift to domestic and nearshore capacity for next-gen flexible circuit and high-voltage assemblies, supported by EV program pipelines and policy incentives. These corridors dominate due to platform proximity, labor pools skilled in harness assembly and testing, and resilient logistics.
What Factors are Leading to the Growth of the US Automotive Wiring Harness Market:
Large, aging vehicle parc and intensive road use: The U.S. has 282,174,766 registered motor vehicles, anchoring continuous replacement and service-part demand for wiring assemblies that degrade with exposure to heat, vibration, and corrosion. Americans drove 3.279 trillion miles in the most recent cycle, intensifying stress on connectors, terminations, and harness junctions across light vehicles, trucks, and buses. High utilization sustains OEM program cadence, particularly for pickups and SUVs which integrate the longest and most connector-dense harnesses, ensuring that line-fit demand remains strong across U.S. assembly corridors.
Electrification and electronics content expansion: Plug-in electric vehicle momentum is reshaping harness architecture toward high-voltage orange cabling, shielded power lines, and higher pin-count connectors. More than 1,000,000 plug-in EVs were sold in a recent year, followed by 1,269,949 plug-in EVs sold by October of the next cycle. This rapidly expanding base drives demand for heavy-gauge cabling, specialized insulation, and EMI-shielded lines for battery packs, inverters, and charging systems. Combined with advanced driver-assistance systems and high-speed data connectivity, this surge adds significant value into the battery/traction and sensor harness domains.
Nearshoring and cross-border manufacturing intensity: Harness production remains labor-intensive and heavily reliant on short lead-time logistics. U.S. surface trade with Canada and Mexico totaled $1.6 trillion, with trucks carrying $1.0 trillion of this value, underscoring the importance of resilient north-south lanes. These corridors feed U.S. vehicle assembly directly from harness plants in Mexico and sub-assembly sites in the U.S. Concentrated gateways such as Laredo channel high volumes of truck freight, enabling just-in-sequence delivery of harness kits and ensuring compliance with USMCA content rules that govern automotive sourcing.
Which Industry Challenges Have Impacted the Growth of the US Automotive Wiring Harness Market:
Copper availability and electrical-grade input risk: Harness costs and performance are tightly linked to copper supply. U.S. mine production reached 1.1 million tons of recoverable copper valued at $9.9 billion, with Arizona alone contributing around 70% of national output. This concentration exposes harness makers to upstream volatility, especially as EV and ADAS adoption increases conductor length and cross-sections. Producers must mitigate risk by qualifying copper-clad aluminum alternatives and applying hedging strategies while ensuring electrical conductivity, thermal stability, and crimp termination reliability across millions of connections per year.
Tight labor conditions in vehicle and parts manufacturing: Harness assembly is highly labor-intensive, requiring skilled technicians for crimping, routing, and continuity testing. Employment in U.S. motor vehicles and parts manufacturing stood at 993,900 workers, reflecting near-peak demand levels and a constrained hiring pool. As multiple OEM platforms launch in parallel, suppliers face mounting pressure to train new workers quickly, maintain takt times, and hit PPAP quality milestones without resorting to excessive overtime. Any gaps in labor availability risk delays, higher defect rates, and supply disruptions for critical harness modules.
Cross-border congestion and logistics sensitivity: Harness kits often cross the U.S.–Mexico border several times during production, moving from wire drawing and connector molding to final assembly and delivery. Truck movements accounted for $1.0 trillion of goods between the U.S., Mexico, and Canada, with wiring harnesses forming a significant portion of automotive parts trade. Even minor delays at ports of entry or customs can disrupt just-in-sequence schedules, especially since vehicle harnesses comprise thousands of unique part numbers. Congestion at major gateways therefore poses a structural risk to program launches and ongoing production.
What are the Regulations and Initiatives which have Governed the Market:
EPA Multi-Pollutant Standards for light- and medium-duty vehicles: The EPA finalized multi-pollutant standards that tighten tailpipe criteria for pollutants and greenhouse gases, covering model years beginning in the next cycle. These regulations push automakers toward higher levels of electrification, directly increasing demand for high-voltage harnesses in battery packs, inverters, on-board chargers, and thermal management systems. Harness manufacturers must design to withstand elevated voltage and temperature conditions, implement EMI shielding, and integrate interlock systems to comply with safety and durability requirements set forth by these standards.
USMCA automotive Rules of Origin and Regional Value Content: The USMCA requires specific Regional Value Content thresholds for auto parts, including wiring harnesses and related components. For parts under heading 8708, minimum RVC levels of 50 and in some cases 70 apply, depending on classification and calculation method. These rules strongly influence sourcing strategies, compelling suppliers to invest in U.S. and Mexican plants to ensure compliance and tariff-free trade eligibility. As a result, plant footprint, material sourcing, and production planning must all be optimized around USMCA origin compliance.
NHTSA FMVSS No. 302 – Flammability of interior materials: NHTSA’s FMVSS 302 regulation mandates that interior materials, including harness coverings and tapes within occupant compartments, must not burn at a rate exceeding 102 millimeters per minute under standard test conditions. This rule forces harness manufacturers to carefully select insulation polymers, sheathing, and protective tapes with validated flame-retardant properties. OEMs require part approval submissions with certified test data, traceability records, and lot-level certifications to demonstrate compliance. Adhering to this standard is critical to safety validation and program approval.
US Automotive Wiring Harness Market Segmentation
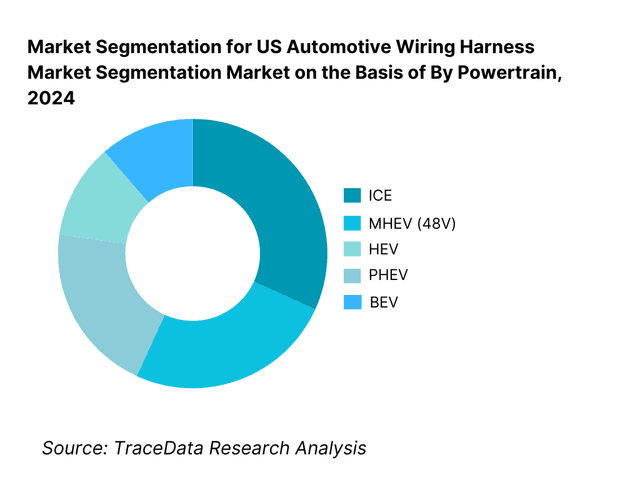
By Powertrain: US Automotive Wiring Harness market is segmented by powertrain into ICE, MHEV, HEV, PHEV, BEV and FCEV. Recently, ICE holds the dominant share in the US under the powertrain segmentation due to the large installed vehicle base and sustained production across pickup/SUV programs with complex body, chassis, and towing harnesses. However, BEV harness value per vehicle is rising fastest as high-voltage battery, inverter, DC/DC and charge harnesses add meters of heavier-gauge cabling, shields and orange-jacket assemblies. OEM platform launches and public financing for domestic EV wiring (e.g., Texas flexible-circuit harness lines) further accelerate high-voltage demand concentration in EV programs.
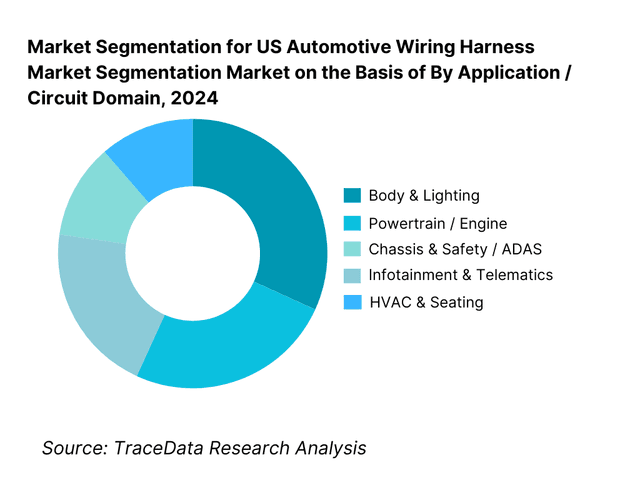
By Application / Circuit Domain: US Automotive Wiring Harness market is segmented by application into powertrain/engine, body & lighting, chassis & safety/ADAS, infotainment & telematics, HVAC & seating, and high-voltage battery & traction. Body & lighting harnesses dominate due to pervasive coverage across doors, roof, tailgate, exterior lamps and interior modules on high-volume trucks and SUVs, resulting in the longest bundles, highest connector counts, and frequent trim-level variations. Meanwhile, high-voltage battery & traction is expanding as BEV models scale, adding shielded cables, busbars and orange-jacket subassemblies that elevate value per vehicle despite lower absolute units versus ICE-led body systems.
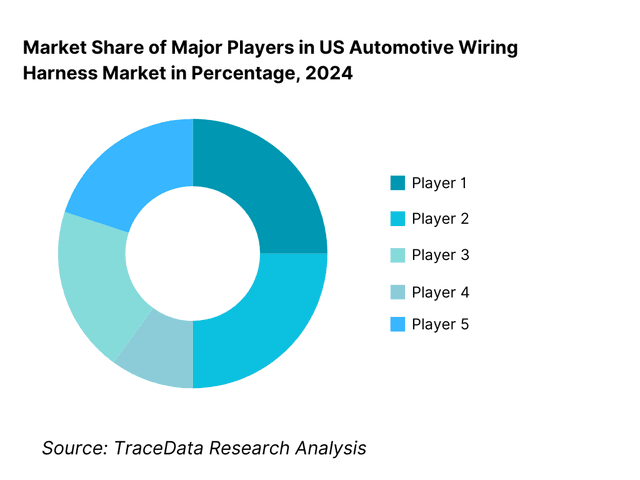
Competitive Landscape in US Automotive Wiring Harness Market
The US automotive wiring harness landscape is anchored by a group of global Tier-1 specialists and diversified electricals suppliers serving Detroit 3, transplants, HD truck and EV startups. Their influence reflects multi-program awards, resident engineering at OEMs, and extensive US–Mexico manufacturing footprints, with EV-ready high-voltage lines and advanced testing (hipot, PD, EMI). Consolidation and nearshoring, coupled with copper hedging practices and digital manufacturing maturity, shape competitive advantage.
Name | Founding Year | Original Headquarters |
Yazaki Corporation | 1941 | Tokyo, Japan |
Sumitomo Wiring Systems | 1917 | Yokkaichi, Japan |
Aptiv (formerly Delphi Automotive) | 1994 | Dublin, Ireland |
Lear Corporation (E-Systems) | 1917 | Southfield, Michigan, USA |
LEONI | 1917 | Nuremberg, Germany |
Samvardhana Motherson | 1986 | Noida, India |
Furukawa Electric | 1896 | Tokyo, Japan |
PKC Group | 1969 | Helsinki, Finland |
Kromberg & Schubert | 1902 | Abensberg, Germany |
DRÄXLMAIER Group | 1958 | Vilsbiburg, Germany |
Yura Corporation | 1970 | Seoul, South Korea |
Electrical Components International | 1953 | St. Louis, Missouri, USA |
Kyungshin | 1974 | Seoul, South Korea |
Fujikura Automotive (Fujikura Ltd.) | 1885 | Tokyo, Japan |
Coroplast Group | 1928 | Wuppertal, Germany |
Some of the Recent Competitor Trends and Key Information About Competitors Include:
Yazaki Corporation: As one of the largest automotive wiring harness suppliers globally, Yazaki has expanded its US–Mexico production footprint to serve new EV programs. In 2024, the company invested in high-voltage harness assembly lines to support 800V architectures, meeting the growing demand for electrification among US OEMs.
Sumitomo Wiring Systems: Known for its long-standing partnerships with Japanese transplants in the US, Sumitomo has recently introduced lightweight aluminum harnesses and copper-clad alternatives, addressing OEM requirements for vehicle weight reduction and cost optimization while maintaining conductivity standards.
Aptiv: A key innovator in data and high-voltage harnesses, Aptiv launched flexible high-voltage busbar solutions in 2024, designed for EV battery packs and inverters. The company also scaled its US engineering hubs to develop zonal E/E architectures, supporting OEM transitions toward software-defined vehicles.
Lear Corporation (E-Systems): Headquartered in Michigan, Lear has focused on enhancing its US-based E-systems division by integrating more automated crimping and testing processes. In 2024, it announced partnerships with multiple EV startups, supplying bespoke harnesses for fast-scaling platforms.
Leoni AG: Leoni continues to supply high-value harnesses for premium OEMs in the US. In 2024, it launched new high-speed data harness solutions supporting ADAS and autonomous vehicle applications, reinforcing its role as a specialist in advanced communication networks within vehicles.
What Lies Ahead for US Automotive Wiring Harness Market?
The US automotive wiring harness market is set to experience a significant shift towards hybrid manufacturing models, combining domestic production with nearshore assembly in Mexico. The U.S. Bureau of Transportation Statistics highlights that cross-border truck freight with Mexico reached $798.8 billion in 2024, with motor vehicles and parts as a leading category. This flow enables OEMs and Tier-1 suppliers to maintain short lead times while balancing labor cost advantages. The hybrid approach ensures resilient supply for high-volume truck and SUV harnesses while supporting electrification-focused investments domestically.
Focus on Outcome-Based Integration: As OEMs increasingly demand outcome-based metrics from harness suppliers, there is a heightened focus on measurable deliverables such as quality (PPM levels), on-time delivery, and engineering change responsiveness. According to the U.S. Federal Highway Administration, the national vehicle fleet has surpassed 282 million registered vehicles, translating into continuous service demand and pressure on suppliers to demonstrate reliability in mass and aftermarket volumes. Harness suppliers must tightly align their manufacturing and quality systems to OEM scorecards to secure long-term awards in this performance-driven environment.
Expansion of EV and High-Voltage Harnessing: Electrification continues to expand rapidly, demanding new types of high-voltage harnesses with heavier-gauge cabling, EMI shielding, and advanced insulation. The U.S. Department of Energy recorded more than 1.2 million plug-in electric vehicles sold nationwide in 2023, a milestone that directly drives incremental demand for traction battery harnesses, inverter cables, and charging connections. As EV adoption accelerates, suppliers will increasingly specialize in high-voltage product lines, leveraging new testing standards such as partial discharge validation and thermal cycle endurance.
Leveraging AI and Automation in Production: The market is also poised to adopt AI and automation for assembly verification and quality assurance. With U.S. manufacturing employing 993,900 workers in motor vehicles and parts as of early 2024, according to the Bureau of Labor Statistics, automation becomes critical to mitigate labor constraints in wire crimping, routing, and continuity testing. Advanced vision systems, robotic assistance, and digital twins for harness design will improve throughput and reduce first-pass yield losses, ensuring suppliers can scale with the rapid growth in both ICE and EV platforms.
US Automotive Wiring Harness Market Segmentation
By Vehicle Type (value %, volume %, sets)
Passenger Cars (sedan/hatchback/crossover/SUV)
Light Commercial Vehicles (class 1–3 vans/pickups)
Medium & Heavy Trucks (class 4–8)
Buses & Coaches (school, transit, coach)
Off-Highway (construction, agriculture, mining, material handling)
Specialty & Low-Volume (performance, upfit, emergency)
By Powertrain (value %, $/vehicle, meters/vehicle)
ICE (gasoline, diesel)
48V Mild Hybrid (MHEV)
Hybrid Electric (HEV)
Plug-in Hybrid (PHEV)
Battery Electric (BEV)
Fuel Cell Electric (FCEV)
By Application / Circuit Domain (value %, connector count, harness length)
Powertrain/Engine
Body & Lighting (doors, roof, tailgate, exterior/interior lamps)
Chassis & Safety/ADAS (ABS/ESC, radar, camera, lidar)
Infotainment & Telematics (head-unit, antennas, connectivity)
HVAC & Seating (blowers, motors, heaters, comfort)
High-Voltage Battery & Traction (pack, inverter, DC/DC, charging)
By Voltage Class (value %, cable gauge mix)
Low Voltage 12V
Low/Medium Voltage 24V (CV/bus)
48V (MHEV)
High Voltage Traction (200–800V+)
By Harness Type (sets, value %)
Main/Body Harness
Engine Harness
Floor/Underbody Harness
Cockpit/Instrument Panel Harness
Door/Roof/Tailgate Harness
Seat Harness
Sensor/Coax (LVDS/GMSL/S-PE)
Battery & HV Sub-assemblies (orange cable, busbar/flex)
Players Mentioned in the Report:
Yazaki
Sumitomo Wiring Systems
Aptiv
Lear (E-Systems)
Leoni
Samvardhana Motherson (Motherson Wiring)
Furukawa Electric (Furukawa Automotive Systems)
PKC Group
Kromberg & Schubert
DRÄXLMAIER Group
Yura Corporation
Nexans Autoelectric
Kyungshin
Fujikura Automotive
Coroplast Group
Key Target Audience
Automotive OEM Purchasing & Program Management (Detroit 3, transplants, EV startups)
Tier-1/Tier-2 Electrical System Integrators & Connector Suppliers
High-Voltage Component Makers (battery pack/inverter/DC-DC manufacturers)
Investments and Venture Capitalist Firms (growth equity in EV supply chains)
Government & Regulatory Bodies (NHTSA, US DOE Loan Programs Office, USTR/USMCA administration, EPA)
Logistics & Cross-Border Trade Operators (US–Mexico shelter/maquiladora partners)
Automation & Test Equipment Providers (cutting/crimping, AOI/vision, hipot/PD systems)
Commodities & Procurement Teams
Time Period:
Historical Period: 2019-2024
Base Year: 2025
Forecast Period: 2025-2030
Explore Flexible Purchase Options or Have Limited Budget?
Pay only for relevant chapters • Customizable report sections
Table of Contents
Choose individual sections to purchase. Mix and match as you like.
4.1. Delivery Model Analysis for Harness Programs-Design-Responsible vs. Build-to-Print vs. Co-Development vs. Aftermarket (margins, OEM preference, strengths/weaknesses, risk transfer, NRE recovery)
4.2. Revenue Streams for US Automotive Wiring Harness Market (line-fit sets, HV battery/traction harnesses, service/aftermarket, tooling/NRE, engineering services, change management fees; metrics: mix %, $/vehicle, sets)
4.3. Business Model Canvas for US Automotive Wiring Harness Market (customer segments by OEM/powertrain, value propositions-weight/cost/quality, channels-SQEs & sourcing portals, key resources-plants/tooling/IP, key partners-wire/connector/tooling suppliers, cost structure-copper/resins/labor/overhead, revenue-piece price + indexers)
5.1. Freelance/Contract Engineering vs. Full-Time Engineering (harness CAD/CAE, resident engineers at OEM sites, design-responsible teams; metrics: time-to-quote, ECN cycle time)
5.2. Investment Model in US Harness Market (greenfield vs. brownfield lines, automation capex for cutting/crimping/testing, shelter/maquiladora models; metrics: capex/line, payback, OEE uplift)
5.3. Comparative Analysis of Program Funneling by Legacy OEMs vs. New-Energy OEMs (RFQ cadence, design freeze discipline, launch volatility, PPAP rigor, sample loops; metrics: NPI velocity, launch PPM)
5.4. Budget Allocation for Harness Content per Vehicle by Segment (base/mid/premium trims; metrics: $/vehicle by domain-powertrain, body, ADAS, infotainment, HV)
8.1. Revenues (In USD Bn; by value/volume, $/vehicle, sets, meters/vehicle, copper kg/vehicle)
9.1. By Market Structure (In-House vs. Outsourced) (value %, sets, program count)
9.2. By Training Type → By Application/Circuit Domain (powertrain, body/lighting, ADAS/safety, infotainment/telemetics, HVAC/seating, HV battery & traction; metrics: value %, meters/vehicle, connectors count)
9.3. By Industry Verticals → By Vehicle Sectors (passenger cars, LCV, M/H trucks, buses, off-highway; metrics: $/vehicle, HV share, ADAS level)
9.4. By Company Size of OEM/IDM (legacy high-volume, transplants, emerging EV, specialty/low-volume; metrics: award probability, engineering model)
9.5. By Employee Designation → Functional Buyer Cohorts (purchasing, SQE, resident engineering, program management; decision criteria & weights)
9.6. By Mode of “Learning” → By Engineering & Manufacturing Modality (build-to-print, design-responsible, co-located engineering cells, digital thread maturity; metrics: ECN lead time)
9.7. Open vs. Customized Programs → Catalog vs. Platform-Specific Harnesses (service parts vs. platform harness; MOQ, inventory policies)
9.8. By Region (US domestic assembly, nearshore Mexico, offshore imports; metrics: landed cost, lead time, RVC %)
10.1. OEM Client Landscape & Cohort Analysis (Detroit 3, transplants, new-energy OEMs, HD/bus; metrics: EV mix, ADAS take-rates, platform cadence)
10.2. Decision-Making Process (sourcing gates, should-cost, VA/VE, DFM/DFA reviews, PPAP sign-off)
10.3. Program Effectiveness & ROI (line-time savings, warranty/PPM reduction, weight/cost trade-offs, commodity pass-through efficacy)
10.4. Gap Analysis Framework (capability vs. requirement: HV readiness, zonal architecture, digital manufacturing, logistics resilience)
11.1. Trends & Developments (zonal E/E, 800V HV, single-pair ethernet, AI vision QC, PFAS-free materials)
11.2. Growth Drivers (EV platform launches, ADAS content, nearshoring/USMCA, 48V proliferation, sustainability mandates)
11.3. SWOT Analysis (installed base, cost curve, design IP, labor/logistics, commodity exposure)
11.4. Issues & Challenges (material inflation, design complexity, labor intensity, connector availability, PPAP timing)
11.5. Government Regulations & Standards (NHTSA/FMVSS electrical safety, TSCA, Buy America/BABA applicability, USMCA RVC; SAE/ISO/IPC/UL compliance matrices)
12.1. Market Size & Future Potential-HV & Data Backbones (value %, meters of HV cable, ethernet/S-PE penetration, busbar adoption)
12.2. Business Models & Revenue Streams (HV assemblies, liquid-cooled busbars, service kits, engineering)
12.3. Delivery Models & Product Types (battery, inverter, DC/DC, charge harness; coax/LVDS, SPE/PoDL)
15.1. Market Share of Key Players (Basis Revenues) (by OEM, by powertrain, by vehicle sector)
15.2. Benchmark of Key Competitors (company overview, USP, strategy, business model, number of plants & lines, estimated headcount, pricing basis & indexers, technology stack, best-selling domains, major OEM clients, alliances/JVs, marketing levers, recent developments)
15.3. Operating Model Analysis Framework (design-responsible vs. BTP, footprint, automation, NPI process, supplier management)
15.4. Gartner-Style Quadrant (Conceptual Placement) (completeness of offering vs. execution ability)
15.5. Bowman’s Strategic Clock for Competitive Advantage (price/value positions & moves)
16.1. Revenues (In USD Bn; scenario cases, EV mix sensitivities, content/vehicle glide paths)
17.1. By Market Structure (In-House vs. Outsourced) (forward view)
17.2. By Application/Circuit Domain (powertrain, body/lighting, ADAS/safety, infotainment/telemetics, HV battery & traction)
17.3. By Vehicle Sectors (passenger cars, LCV, M/H trucks, buses, off-highway)
17.4. By OEM Archetype (legacy OEMs, transplants, emerging EV, specialty/low-volume)
17.5. By Buyer Function (purchasing/SQE/engineering program ownership split)
17.6. By Engineering/Manufacturing Modality (design-responsible, BTP, co-located, digital thread)
17.7. Catalog vs. Platform-Specific Programs (service parts vs. platform; inventory/MOQ outlook)
17.8. By Production Region (US, Mexico, offshore; RVC outlook, landed cost)
Discuss a Customized Research Scope
Custom research scope • Tailored insights • Industry expertise
Research Methodology
Step 1: Ecosystem Creation
Map the ecosystem and identify all the demand-side and supply-side entities for the US Automotive Wiring Harness Market. On the demand side, this includes automotive OEMs (Detroit 3, Japanese/Korean transplants, European luxury brands, EV startups) and commercial vehicle manufacturers (truck, bus, off-highway). On the supply side, this spans Tier-1 wiring harness suppliers, Tier-2 connector/terminal makers, Tier-3 raw material providers (copper, resins), tooling/machinery vendors, logistics operators, and quality/testing labs. Based on this ecosystem, we will shortlist 5–6 leading wiring harness providers operating in the US market (such as Yazaki, Sumitomo, Aptiv, Lear, and Leoni) by evaluating their financial performance, client base, plant footprint, and technological readiness (especially for high-voltage harnesses). Sourcing is conducted through government trade databases, OEM production data, company filings, and proprietary industry reports to collate industry-level information.
Step 2: Desk Research
Subsequently, we engage in an exhaustive desk research process by referencing diverse secondary and proprietary databases. This approach enables a thorough analysis of the US Automotive Wiring Harness Market, aggregating industry-level insights. We delve into aspects such as the number of new vehicles produced and sold (15.5 million units sold in the latest cycle), labor force participation in the motor vehicle and parts industry (993,900 employees, BLS), and freight volumes tied to cross-border harness logistics (trucking trade worth $1.0 trillion with Mexico, BTS). We supplement this with detailed examinations of company-level data, relying on SEC filings, annual reports, sustainability disclosures, and press releases. This builds a foundation for understanding revenue streams, product segmentation (low-voltage vs. high-voltage harnesses), and OEM-supplier program linkages.
Step 3: Primary Research
We initiate a series of in-depth interviews with executives and stakeholders representing wiring harness suppliers, OEM engineering/purchasing departments, and logistics providers. The interview process serves a multi-faceted purpose: to validate market hypotheses (e.g., EV high-voltage harness content per vehicle), authenticate statistical data (employment, production volumes, export-import values), and extract valuable operational and financial insights. A bottom-to-top approach is undertaken to evaluate revenue contributions of each leading supplier by analyzing program awards, plant utilization, and delivery metrics. This is aggregated to arrive at the overall market structure. As part of validation, our team executes disguised interviews by posing as potential clients to harness suppliers. This allows us to verify operational details such as production lead times, automation investments, copper hedging practices, and plant footprints. These insights are cross-checked against secondary sources for accuracy.
Step 4: Sanity Check
A bottom-to-top and top-to-bottom reconciliation is performed to test the robustness of the findings. In the top-down approach, vehicle sales and production volumes (15.7 million forecast, Cox Automotive) are multiplied by average harness content per vehicle (low-voltage and high-voltage separately). In the bottom-up approach, supplier revenues from US and Mexico plants are aggregated and validated against OEM sourcing records. Discrepancies are reconciled using sensitivity analysis on EV adoption rates, OEM program launches, and labor availability. This ensures that the final output is both internally consistent and aligned with validated macroeconomic indicators from government sources.
See What's Inside the Report
Get a preview of key findings, methodology and report coverage
Frequently Asked Questions
The US Automotive Wiring Harness Market holds strong potential, reaching a valuation of USD 6,575.5 million in 2023 (Grand View Research Horizon databook). This potential is driven by the country’s large vehicle fleet of 282.1 million registered motor vehicles (FHWA) and high road usage totaling 3.279 trillion miles traveled (FHWA). Rising electrification is accelerating demand for high-voltage harnesses, while advanced ADAS and infotainment features increase harness complexity. Together, these drivers make the market strategically vital for OEMs and suppliers across the US.
The US Automotive Wiring Harness Market features several global leaders, including Yazaki, Sumitomo Wiring Systems, and Aptiv. These companies dominate the market with long-standing OEM partnerships, diversified harness portfolios, and robust US–Mexico production networks. Other notable players include Lear Corporation, Leoni, Samvardhana Motherson, Furukawa Electric, PKC Group, and DRÄXLMAIER Group, which focus on EV high-voltage harnesses, premium vehicle applications, and zonal architectures. Collectively, these players define the competitive landscape through their engineering capacity, global supply chains, and compliance with USMCA regional value content rules.
Key growth drivers include the scale of vehicle activity and utilization, with over 282 million registered vehicles and 3.279 trillion miles driven reinforcing continuous demand for service harnesses and replacements (FHWA). The surge in electrification, backed by DOE data of 1.27 million plug-in EVs sold in 2023 (DOE VTO), expands high-voltage harness demand. Additionally, robust cross-border trade—totaling $1.6 trillion in US surface trade with Canada and Mexico (BTS)—enables nearshoring of harness assembly, supporting just-in-sequence deliveries and compliance with USMCA.
The US market faces several challenges, including commodity risk, with US copper mine output at 1.1 million tons valued at $9.9 billion and concentrated 70% in Arizona (USGS), exposing harness makers to supply shocks. Labor constraints also pressure the industry, with 993,900 employees in motor vehicles and parts manufacturing (BLS), reflecting tight capacity for labor-intensive harness assembly. Finally, cross-border congestion poses logistical risks: truck freight with Mexico alone accounts for $798.8 billion, and bottlenecks at major gateways threaten just-in-sequence harness delivery.
License Options
PDF + Excel
Complete report package
$4,000
Excel Only
Data and analytics
$2,500
Custom Sections
Starts from $100
$0