US Paper Packaging Market Outlook to 2030
By Market Structure, By Product Type, By Paper Grade, By End-Use Industry, By Barrier/Coating, and By Region
Report Overview
Report Code
TDR0398
Coverage
North America
Published
December 2025
Pages
80
Flexible Purchase Options
Select and purchase only the chapters you need for your strategic decisions
On This Page
Report Overview
The report titled “US Paper Packaging Market Outlook to 2030 - By Market Structure, By Product Type, By Paper Grade, By End-Use Industry, By Barrier/Coating, and By Region” provides a comprehensive analysis of the paper packaging market in the United States. The report covers an overview and genesis of the industry, overall market size in terms of revenue, market segmentation; trends and developments, regulatory landscape, customer level profiling, issues and challenges, and competitive landscape including competition scenario, cross-comparison, opportunities and bottlenecks, and company profiling of major players in the paper packaging market.
Report Coverage
Verified Market Sizing
Multi-layer forecasting with historical data and 5–10 year outlook
Deep-Dive Segmentation
Cross-sectional analysis by product type, end user, application and region
Competitive Benchmarking & Positioning
Market share, operating model, pricing and competition matrices
Actionable Insights & Risk Assessment
High-growth white spaces, underserved segments, technology disruptions and demand inflection points
Review Methodology & Data Structure
Preview report structure, data sources and research framework
Executive Summary
The report titled “US Paper Packaging Market Outlook to 2030 - By Market Structure, By Product Type, By Paper Grade, By End-Use Industry, By Barrier/Coating, and By Region” provides a comprehensive analysis of the paper packaging market in the United States. The report covers an overview and genesis of the industry, overall market size in terms of revenue, market segmentation; trends and developments, regulatory landscape, customer level profiling, issues and challenges, and competitive landscape including competition scenario, cross-comparison, opportunities and bottlenecks, and company profiling of major players in the paper packaging market. The report concludes with future market projections based on shipments and converting volumes, product families, paper grades, regions, cause-and-effect relationships, and success case studies highlighting the major opportunities and cautions.
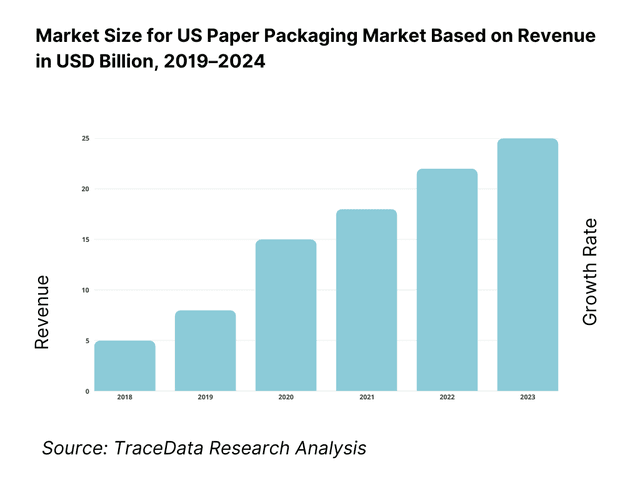
US Paper Packaging Market Overview and Size
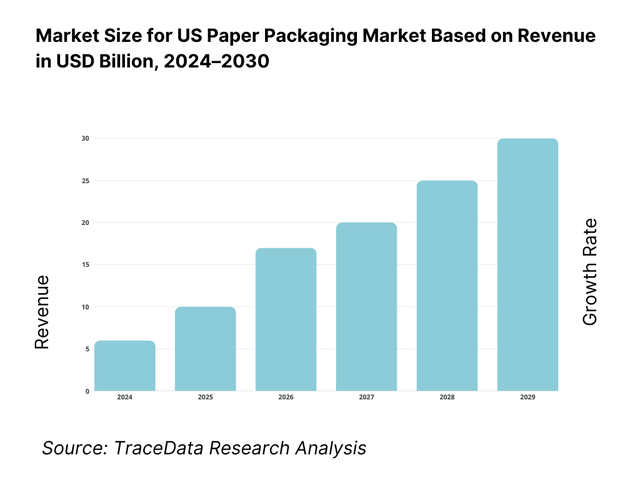
The US paper packaging market sits just under the USD 70 billion mark based on a five-year historical read across US series and adjacent NA market indicators; GVR places US paper packaging revenue at USD 69,027.7 million in the current cycle, with a continuous 2018–present series behind the paywall. Demand is anchored by parcel fulfillment and foodservice. US parcel shipments were 21.65 billion and rose to 22.37 billion the following cycle, sustaining corrugated, mailers, bags and cups consumption.
Leadership clusters around the South and Midwest manufacturing belts—corrugated and cartonboard capacity is densest near fiber supply, integrated mills and low-cost power, while Atlanta, Memphis, Chicago, Dallas–Fort Worth and Southern California anchor converting and distribution. E-commerce hubs (California, Texas, New York/New Jersey) drive high box/mailer turns; proximity to major ports and parcel sortation supports time-sensitive packaging flows. Corporate footprints and investment disclosures from top producers (e.g., Pratt’s Georgia expansion; IP and WestRock networks) illustrate this geographic pull.
What Factors are Leading to the Growth of the US Paper Packaging Market:
Scale of food consumption and foodservice rotation supports fiber formats: The U.S. food economy is a central driver of paper packaging demand, especially for corrugated boxes, folding cartons, cups, trays, and wraps. Total food spending stood at $2.58 trillion in 2024, out of which $1.52 trillion was attributed to foodservice outlets. Within foodservice, $552.7 billion came from full-service restaurants and $550.7 billion from limited-service establishments. These high-value flows translate into enormous daily usage of cups, clamshells, trays, and takeaway cartons, ensuring that order-ready paper packaging formats remain in constant circulation across grocery distribution centers, quick-service outlets, and club retail channels.
Digital commerce and freight activity pull corrugated and mailers: The rapid scale of e-commerce continues to underpin corrugated shippers and paper mailers in the U.S. retail ecosystem. In the second quarter of 2025, retail e-commerce sales were $304.2 billion, against total retail of $1,865.4 billion. This volume requires robust corrugated packaging formats that can withstand shipping cycles and right-sized mailers that comply with dimensional weight pricing. Supporting this, the Freight Transportation Services Index was 137.3 in December 2024, only slightly below the all-time peak of 141.4, illustrating the structural weight of logistics flows. These metrics sustain steady demand for corrugated and recyclable paper mailers that enable safe and compliant fulfillment.
Policy signals accelerate paper substitution and coating innovation: Governmental and regulatory actions are directly pushing the U.S. paper packaging sector towards sustainable transformation. In February 2024, the FDA confirmed that PFAS-based grease-proofing substances were no longer sold for food-contact packaging, and by January 2025 it had withdrawn authorization for 35 Food Contact Notifications tied to PFAS. At the same time, statewide Extended Producer Responsibility (EPR) programs in California, Oregon, and Colorado are mandating producer responsibilities for packaging recovery. These concrete steps are compelling converters and mills to adopt recyclable, PFAS-free barriers, spurring investment in dispersion coatings, molded fiber, and repulpable laminates, ensuring compliance while meeting the growing demand for sustainable solutions.
Which Industry Challenges Have Impacted the Growth of the US Paper Packaging Market:
Energy intensity meets elevated industrial power prices: Paper packaging production is highly energy-intensive, and electricity pricing directly impacts operational economics. The average U.S. industrial electricity price was 8.15 cents per kWh in 2024, rising to 9.29 cents per kWh in July 2025, with the rolling 12-month average at 8.40 cents per kWh. These levels influence decisions on mill operations, grade conversions, and lightweighting strategies. Even small shifts in per-kWh costs scale into millions in additional expenditure for integrated mills consuming megawatts of continuous power, making energy price volatility a critical challenge for sustainable cost management in the sector.
Freight normalization complicates packaging demand planning: The transportation system’s performance has a direct bearing on corrugated order cycles and inventory management. The Freight Transportation Services Index measured 137.3 in December 2024, down from the all-time high of 141.4 but still elevated compared with pandemic lows. This partial normalization slows replenishment speeds, lengthens grocery multipack cycles, and reduces urgent reshipments in e-commerce. For converters and brand owners, such changes extend reorder intervals, complicating demand forecasting and inventory positioning. This volatility forces plants to manage labor, sheet supply, and short-run orders more carefully to maintain service levels.
Workforce tightness and skills mix in NAICS 322: Labor shortages remain a persistent hurdle for paper packaging production. The Bureau of Labor Statistics recorded 328.9 thousand workers in paper manufacturing (NAICS 322) in 2024, of which 73.6 thousand were in pulp, paper, and paperboard mills and 255.3 thousand in converted paper product manufacturing. This distribution reflects structural reliance on skilled operators across both mill and converting segments. Recruiting multi-skilled technicians for coater lines, corrugators, and digital print equipment is increasingly difficult in Southern and Midwestern states, where unemployment rates are lower. These constraints lead to higher downtime, slower upgrades, and delays in scaling PFAS-free or digitally printed paper packaging solutions.
What are the Regulations and Initiatives which have Governed the Market:
FDA food-contact actions on PFAS drive barrier reformulation: The FDA’s actions are reshaping the regulatory landscape for paper packaging. In February 2024, it confirmed the exit of PFAS-based grease-proofing agents from food-contact applications. By January 2025, the agency further determined that 35 Food Contact Notifications connected to PFAS were no longer effective. This dual intervention compels converters to invest in PFAS-free dispersion or biopolymer coatings that can meet kit number, MVTR, and oxygen transmission performance requirements while remaining recyclable. Such policy changes are creating enforceable deadlines for compliance and accelerating adoption of safe alternatives across cups, trays, and wraps.
California SB 54 Packaging EPR sets quantified obligations: California’s SB 54 has introduced mandatory obligations for packaging producers. The legislation requires that by 2032, 100% of packaging be recyclable or compostable, 25% of plastic packaging be source-reduced, and 65% of single-use plastic packaging be recycled. Even though paper packaging aligns with many recyclability criteria, the program imposes financial contributions and detailed reporting requirements on all material streams. For mills and converters, this means stricter oversight on recycled-content attestations, chain-of-custody documentation, and fiber sourcing audits, ensuring higher accountability for producers in the U.S.’s largest consumer market.
Oregon and Colorado implement producer registration and program plans: Both Oregon and Colorado have rolled out Extended Producer Responsibility (EPR) frameworks that directly affect the paper packaging industry. In February 2025, Oregon DEQ approved a Producer Responsibility Organization program plan under its Recycling Modernization Act, setting operational duties for packaging and paper producers beginning July 2025. Colorado’s HB22-1355 mandates that producers of packaging and paper products join a PRO and fund a statewide recycling system. These numeric milestones establish strict compliance timelines, forcing brand owners and converters in these states to align packaging formats, recyclability claims, and reporting systems to meet legally binding requirements.
US Paper Packaging Market Segmentation
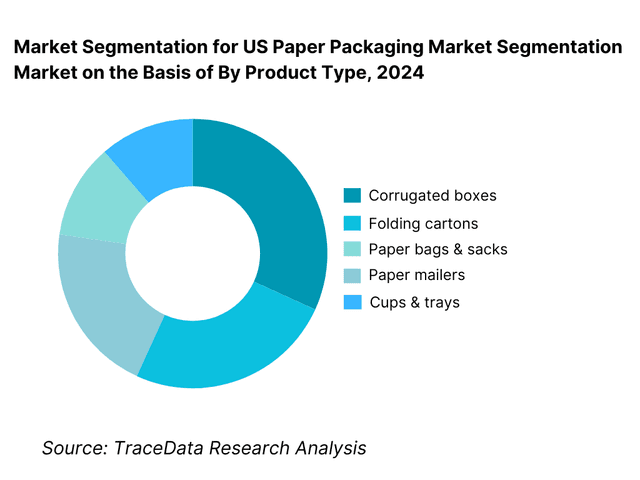
By Product Type: US paper packaging market is segmented by product type into corrugated boxes, folding cartons, paper bags & sacks, paper mailers, and cups & trays. Recently, corrugated boxes hold the dominant position under this segmentation. This is due to their central role in omnichannel fulfillment and retail replenishment, the ubiquity of right-sized RSC/die-cut formats, and continuous DC automation upgrades that favor corrugated throughput. National parcel volumes in the 21–22 billion range, alongside club and grocery multipacks, sustain high conversion runs and recurrent board demand, keeping corrugated at the top of the product mix.
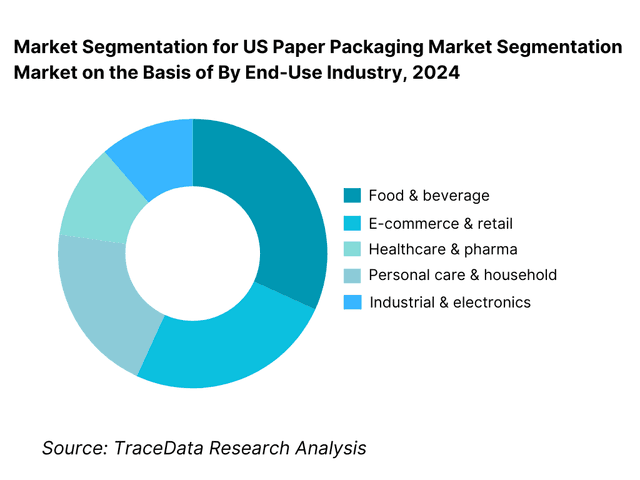
By End-Use Industry: US paper packaging market is segmented by end-use into food & beverage, e-commerce & retail, healthcare & pharma, personal care & household, and industrial & electronics. Food & beverage currently dominates this segmentation owing to the sheer frequency of packaged-goods turns, grocery/private-label proliferation, and QSR/off-premise volumes that favor fiber-based cartons, trays, wraps and hot/cold cups. Continuous reformulation toward PFAS-free barriers and improved grease/moisture resistance also channels new spend into paper formats across bakery, dairy, beverages and meal kits, reinforcing F&B’s lead.
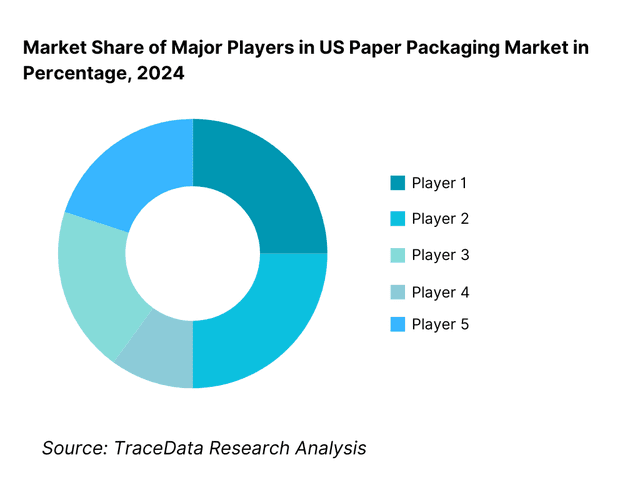
Competitive Landscape in US Paper Packaging Market
The US paper packaging competitive arena is anchored by integrated mill-to-box systems and scale converters. Consolidation remains influential (e.g., WestRock with Smurfit Kappa forming Smurfit WestRock globally), while targeted closures/rationalizations (e.g., International Paper) reflect pricing, input costs and demand normalization. Capacity announcements and brownfield debottlenecking focus on lighter-weight containerboard, digital print and PFAS-free barrier lines.
Name | Founding Year | Original Headquarters |
International Paper | 1898 | Memphis, Tennessee, USA |
WestRock (Smurfit WestRock) | 2015 | Atlanta, Georgia, USA |
Packaging Corporation of America (PCA) | 1959 | Lake Forest, Illinois, USA |
Graphic Packaging International | 1991 | Atlanta, Georgia, USA |
Georgia-Pacific (Packaging & Cellulose) | 1927 | Atlanta, Georgia, USA |
Pratt Industries (USA) | 1989 | Atlanta, Georgia, USA |
Smurfit Kappa North America | 1934 | Dublin, Ireland |
DS Smith North America | 1940 | London, UK |
Sonoco Products Company | 1899 | South Carolina, USA |
Greif Inc. | 1877 | Delaware, Ohio, USA |
Pactiv Evergreen | 1959 | Lake Forest, Illinois, USA |
Huhtamaki North America | 1920 | Espoo, Finland |
Clearwater Paper | 2008 | Spokane, Washington, USA |
Cascades (USA) | 1964 | Kingsey Falls, Quebec, Canada |
Novolex (Duro Bag & Paper Brands) | 2003 | Hartsville, South Carolina, USA |
Some of the Recent Competitor Trends and Key Information About Competitors Include:
International Paper: As the largest producer of containerboard and corrugated packaging in the US, International Paper announced mill rationalizations in 2023 to streamline costs while simultaneously investing in lightweight containerboard grades to meet rising e-commerce demand. The company has also accelerated development of PFAS-free barrier-coated papers for foodservice clients.
WestRock (Smurfit WestRock): Following its merger with Smurfit Kappa in 2024, WestRock is focusing on global integration and operational synergies. In the US, the company has invested heavily in automated converting plants and right-sized packaging formats to cater to omnichannel retail and parcel logistics.
Packaging Corporation of America (PCA): PCA continues to strengthen its Midwest and South footprint, with recent investments in capacity expansions at Illinois and Texas mills. Its strategy emphasizes maintaining high service levels to industrial and consumer goods customers, with growing interest in digital print corrugated solutions.
Pratt Industries (USA): Known for its 100% recycled containerboard model, Pratt opened a USD 500 million paper mill in Kentucky in 2024, reinforcing its leadership in sustainability-driven packaging. The company continues to expand its footprint in corrugated and e-commerce mailers, aligning with brand commitments to use recycled content.
Graphic Packaging International: A key player in folding cartons and paperboard, Graphic Packaging has expanded its capacity with the billion-dollar Kalamazoo machine, one of the largest cartonboard projects in North America. Its focus is on food and beverage packaging, particularly PFAS-free cups, trays, and wraps for QSR chains.
What Lies Ahead for US Paper Packaging Market?
The US paper packaging market is expected to maintain steady growth in the coming years, supported by sustainability regulations, the ongoing expansion of e-commerce shipments, and rising substitution of plastic by recyclable and compostable fiber-based solutions. Strong foodservice consumption, numbering $1.52 trillion annually in sales across restaurants and outlets (USDA ERS), and consistent parcel shipments of more than 22 billion packages (U.S. Census Bureau & BTS) provide a robust foundation for demand. Regulatory actions, including FDA’s PFAS restrictions and state-level EPR programs, further accelerate innovation in barrier-coated paper packaging.
Rise of Hybrid Packaging Models: Future demand is likely to see a hybridization of formats — combining corrugated, cartons, and molded fiber with recyclable coatings or laminates. This is fueled by omnichannel retail models that blend in-store replenishment with direct-to-consumer parcels. With U.S. e-commerce sales already at $304.2 billion in Q2 2025 (U.S. Census Bureau), converters are investing in diversified lines to balance grocery club packs, quick-serve trays, and e-commerce-ready mailers. Hybrid approaches reduce SKU redundancy, improve fulfillment efficiency, and address consumer expectations for recyclable and curbside-accepted packaging.
Focus on Outcome-Based Packaging Solutions: Brands and retailers are demanding outcome-based performance in packaging — durability in freight, grease resistance in foodservice, and recyclability compliance. With the Freight Transportation Services Index at 137.3 in December 2024 (BTS), pressure remains high on box integrity and optimized corrugated designs to withstand handling. Likewise, QSR outlets generating over $550.7 billion in limited-service restaurant sales (USDA ERS) create a steady need for food-contact paper packaging that balances moisture barrier with repulpability. Future investments will therefore emphasize measurable outcomes such as on-time-in-full delivery, recyclability certification, and kit rating performance in PFAS-free papers.
Expansion of Sector-Specific Applications: Paper packaging will expand deeper into sectors requiring specialized performance. Food & beverage already consumes $2.58 trillion in U.S. spending (USDA ERS), sustaining cartons, trays, and wraps. Healthcare, supported by over 6,000 U.S. hospitals (AHA), increasingly needs sterile wraps and folding cartons for pharma. E-commerce, with its $1.86 trillion quarterly retail turnover (U.S. Census), will keep driving corrugated and paper mailers. Each of these verticals is likely to push suppliers toward tailored innovations: grease-resistant trays for QSR, barrier cartons for pharma, and lightweight die-cuts for parcel optimization.
Leveraging AI and Automation in Converting: Automation and AI are poised to transform converting and logistics alignment. Robotics already drive case erectors and sealers in fulfillment centers; future investments will incorporate machine vision and AI-driven print alignment for short-run digital cartons. The U.S. Bureau of Labor Statistics notes 255.3 thousand workers in converted paper product manufacturing (NAICS 322) as of 2024, highlighting the labor-intensive nature of packaging. Automation becomes essential to manage rising throughput while reducing downtime. AI-based optimization of cutting and creasing patterns also reduces waste, aligning with EPR-driven mandates for source reduction and recyclability compliance.
US Paper Packaging Market Segmentation
By Product Type
Corrugated boxes
Folding cartons
Paper bags & sacks
Paper mailers
Cups & foodservice
Specialty protective
By End-Use Industry
Food & beverage
E-commerce & retail
Healthcare & pharma
Personal care & household
Industrial & electronics
Automotive & aftermarket
By Paper Grade
Containerboard: linerboard (kraft/testliner), corrugating medium
Cartonboard: SBS, SUS/CUK, FBB, CRB
Kraft papers: MG/MF, extensible, sack kraft
Specialty papers: grease-resistant, release, barrier base, glassine
Molded fiber: recycled pulp and virgin fiber bases
By Form / Format
Boxes
Cartons
Bags/Sacks
Mailers
Foodservice
Protective
By Barrier / Coating
PFAS-free aqueous dispersion (grease/oil resistance)
Biopolymer/compostable coatings (e.g., PLA/PHA blends)
Extrusion-coated (PE/PP/other where required)
Hybrid barrier laminations (paper–paper, paper–thin film, repulpable)
Uncoated printable (inkjet/offset/digital receptive)
Players Mentioned in the Report:
International Paper
WestRock (Smurfit WestRock)
Packaging Corporation of America
Graphic Packaging International
Georgia-Pacific
Pratt Industries (USA)
Smurfit Kappa North America
DS Smith North America
Sonoco Products
Greif
Pactiv Evergreen
Huhtamaki North America
Clearwater Paper
Cascades (USA)
Novolex
Key Target Audience
FMCG and CPG procurement heads (food, beverage, household)
E-commerce marketplace operations (shipping packaging leads)
Grocery & club retail private-label teams
Foodservice brand owners & franchise operators (QSR, fast casual)
Contract packagers / 3PL fulfillment leaders
Investments and venture capitalist firms (packaging tech, coatings, automation)
Government and regulatory bodies (EPA; FDA; state EPR authorities; FTC – Green Guides)
Sustainability & ESG program heads
Time Period:
Historical Period: 2019-2024
Base Year: 2025
Forecast Period: 2025-2030
Explore Flexible Purchase Options or Have Limited Budget?
Pay only for relevant chapters • Customizable report sections
Table of Contents
Choose individual sections to purchase. Mix and match as you like.
4.1 Delivery Model Analysis for Paper Packaging-Corrugated, Folding Cartons, Bags & Mailers, Cups & Trays [Margins, Preference, Strengths, Weaknesses]
4.2 Revenue Streams for US Paper Packaging Market [containerboard sales, converting revenue, contract packaging services, licensing]
4.3 Business Model Canvas for US Paper Packaging Market
5.1 Integrated Producers vs Independent Converters [capacity share, cost position, customer base]
5.2 Investment Model in US Paper Packaging Market [mill upgrades, brownfield/greenfield investments, automation in converting]
5.3 Comparative Analysis of Procurement by Large Retailers vs SMEs [private-label packaging programs, co-packing reliance]
5.4 Packaging Budget Allocation by Company Size [large FMCGs, mid-tier brands, SMEs]
8.1 Revenues [In USD Bn; containerboard shipments, folding carton revenues, mailers, bags, cups & trays]
9.1 By Market Structure (Integrated & Independent Converters)
9.2 By Product Type (Corrugated Boxes, Folding Cartons, Paper Bags & Sacks, Paper Mailers, Cups & Trays)
9.3 By End-Use Industry (Food & Beverage, E-commerce & Retail, Healthcare & Pharma, Personal Care, Industrial & Electronics)
9.4 By Company Size (Large FMCGs, Mid-sized Enterprises, SMEs)
9.5 By Application Format (RSC boxes, Die-cut cartons, SOS bags, Padded mailers, Molded fiber trays)
9.6 By Barrier/Coating (PFAS-free dispersion, Biopolymer coatings, Extrusion-coated, Uncoated)
9.7 By Open vs Customized Packaging Programs
9.8 By Region (Northeast, Midwest, South, West)
10.1 Brand Owner Landscape & Cohort Analysis [FMCGs, retailers, e-commerce giants, SMEs]
10.2 Packaging Procurement Needs & Decision-Making Process
10.3 Packaging Effectiveness & ROI Analysis [cost per unit shipped, shelf impact, recyclability perception]
10.4 Gap Analysis Framework [plastic-to-paper substitution potential, recycling infrastructure gaps]
11.1 Trends & Developments [lightweighting, right-sizing, automation, on-pack sustainability claims]
11.2 Growth Drivers [e-commerce growth, sustainability mandates, PFAS ban, foodservice expansion]
11.3 SWOT Analysis [fiber strength, regulatory pressure, substitution risk, scale advantage]
11.4 Issues & Challenges [OCC volatility, freight costs, PFAS compliance, competitive imports]
11.5 Government Regulations [EPR programs, FDA food-contact approvals, FTC Green Guides, state PFAS bans]
12.1 Market Size & Future Potential for E-commerce-Driven Paper Packaging
12.2 Business Model & Revenue Streams [shipper programs, private label, subscription packaging]
12.3 Delivery Models & Type of Packaging Formats [mailers, right-sized corrugated, fiber-based insulation]
15.1 Market Share of Key Players by Revenues [corrugated, cartonboard, mailers, foodservice packaging]
15.2 Benchmark of Key Competitors [Company Overview, USP, Business Strategies, Business Model, Number of Plants, Revenues, Pricing Basis Type of Packaging, Technology Used, Best-Selling Formats, Major Clients, Strategic Tie-Ups, Marketing Strategy, Recent Developments]
15.3 Operating Model Analysis Framework
15.4 Gartner Magic Quadrant for Packaging Solutions
15.5 Bowman’s Strategic Clock for Competitive Advantage
16.1 Revenues [In USD Bn; projections]
17.1 By Market Structure (Integrated & Independent Converters)
17.2 By Product Type (Corrugated, Folding Cartons, Bags, Mailers, Cups & Trays)
17.3 By End-Use Industry (Food & Beverage, E-commerce, Healthcare, Personal Care, Industrial)
17.4 By Company Size (Large Enterprises, Medium Enterprises, SMEs)
17.5 By Application Format (Corrugated RSC, Folding Cartons, Bags, Mailers, Molded Fiber)
17.6 By Barrier/Coating (PFAS-free, Biopolymer, Extrusion, Uncoated)
17.7 By Open vs Customized Packaging Programs
17.8 By Region (Northeast, Midwest, South, West)
Discuss a Customized Research Scope
Custom research scope • Tailored insights • Industry expertise
Research Methodology
Step 1: Ecosystem Creation
Map the ecosystem and identify all the demand-side and supply-side entities for the US Paper Packaging Market. Based on this ecosystem, we will shortlist leading 5–6 packaging producers in the country based on their financial information, market reach, and client base. Sourcing is conducted through industry articles, multiple secondary, and proprietary databases to perform desk research around the market to collate industry-level information.
Step 2: Desk Research
Subsequently, we engage in an exhaustive desk research process by referencing diverse secondary and proprietary databases. This approach enables us to conduct a thorough analysis of the market, aggregating industry-level insights. We delve into aspects like the installed production capacities, product mix (corrugated, folding cartons, bags, mailers, cups & trays), demand from foodservice and e-commerce, and other key variables. We supplement this with detailed examinations of company-level data, relying on sources like press releases, annual reports, financial statements, and similar documents. This process aims to construct a foundational understanding of both the market and the entities operating within it.
Step 3: Primary Research
We initiate a series of in-depth interviews with C-level executives and other stakeholders representing various US Paper Packaging Market companies and end-users. This interview process serves a multi-faceted purpose: to validate market hypotheses, authenticate statistical data, and extract valuable operational and financial insights from these industry representatives. A bottom-to-top approach is undertaken to evaluate revenue contributions for each player, thereby aggregating to the overall market. As part of our validation strategy, our team executes disguised interviews wherein we approach each company under the guise of potential clients. This approach enables us to validate the operational and financial information shared by company executives, corroborating this data against what is available in secondary databases. These interactions also provide us with a comprehensive understanding of revenue streams, value chains, processes, pricing, and other factors.
Step 4: Sanity Check
A bottom-to-top and top-to-bottom analysis along with market size modeling exercises is undertaken to assess the sanity of the process.
See What's Inside the Report
Get a preview of key findings, methodology and report coverage
Frequently Asked Questions
The US Paper Packaging Market is positioned for steady expansion, with a valuation of USD 69.0 billion in 2024. This potential is driven by strong food and beverage demand, with national food spending at USD 2.58 trillion (USDA ERS), and by e-commerce, which accounted for USD 304.2 billion in sales in Q2 2025 (U.S. Census). The market’s capacity to grow is reinforced by regulatory support for recyclable packaging and brand commitments to plastic-to-paper substitution, particularly in foodservice and online fulfillment.
The US Paper Packaging Market features several key players, including International Paper, WestRock (Smurfit WestRock), and Packaging Corporation of America (PCA). These companies dominate due to their integrated mill-to-box systems, extensive converting footprints, and long-term brand partnerships. Other notable players include Graphic Packaging International, Pratt Industries, Georgia-Pacific, DS Smith, Smurfit Kappa North America, Sonoco Products, Greif, Pactiv Evergreen, Huhtamaki North America, Clearwater Paper, Cascades, and Novolex, each contributing specialized expertise across corrugated, folding cartons, bags, mailers, and foodservice packaging.
The primary growth drivers include robust foodservice consumption, with Americans spending USD 1.52 trillion at foodservice outlets (USDA ERS), which fuels demand for cups, trays, and wraps. E-commerce growth also underpins corrugated and mailer demand, with total quarterly online sales reaching USD 304.2 billion in 2025 (U.S. Census). Additionally, regulatory measures such as FDA’s elimination of PFAS-based grease-proofing agents in 2024 push brands toward innovative barrier-coated papers, supporting both sustainability and performance needs in the food and retail supply chains.
The US Paper Packaging Market faces several challenges, including rising industrial electricity costs, which averaged 8.15 cents per kWh in 2024 (EIA), directly impacting energy-intensive papermaking. Workforce constraints also pose hurdles, with 328.9 thousand workers employed in NAICS 322 paper manufacturing in 2024 (BLS), limiting skilled labor availability for advanced coating and digital printing lines. Additionally, freight activity fluctuations—illustrated by the Freight TSI index at 137.3 in December 2024 (BTS)—complicate demand forecasting and packaging inventory cycles, creating uncertainty for converters and mills.
License Options
PDF + Excel
Complete report package
$4,000
Excel Only
Data and analytics
$2,500
Custom Sections
Starts from $100
$0