USA Recreational Boating Market Outlook to 2035
By Boat Type, By Propulsion, By End-User Profile, By Sales & Ownership Model, and By Region
Report Overview
Report Code
TDR0450
Coverage
Central and South America
Published
January 2026
Pages
80
Flexible Purchase Options
Select and purchase only the chapters you need for your strategic decisions
On This Page
Report Overview
The report titled “USA Recreational Boating Market Outlook to 2035 – By Boat Type, By Propulsion, By End-User Profile, By Sales & Ownership Model, and By Region” provides a comprehensive analysis of the recreational boating industry in the United States. The report covers an overview and genesis of the market, overall market size in terms of value, detailed market segmentation; trends and developments, regulatory and safety landscape, buyer-level demand profiling, key issues and challenges, and competitive landscape including competition scenario, cross-comparison, opportunities and bottlenecks, and company profiling of major players in the USA recreational boating market.
Report Coverage
Verified Market Sizing
Multi-layer forecasting with historical data and 5–10 year outlook
Deep-Dive Segmentation
Cross-sectional analysis by product type, end user, application and region
Competitive Benchmarking & Positioning
Market share, operating model, pricing and competition matrices
Actionable Insights & Risk Assessment
High-growth white spaces, underserved segments, technology disruptions and demand inflection points
Review Methodology & Data Structure
Preview report structure, data sources and research framework
Executive Summary
The report titled “USA Recreational Boating Market Outlook to 2035 – By Boat Type, By Propulsion, By End-User Profile, By Sales & Ownership Model, and By Region” provides a comprehensive analysis of the recreational boating industry in the United States. The report covers an overview and genesis of the market, overall market size in terms of value, detailed market segmentation; trends and developments, regulatory and safety landscape, buyer-level demand profiling, key issues and challenges, and competitive landscape including competition scenario, cross-comparison, opportunities and bottlenecks, and company profiling of major players in the USA recreational boating market.
The report concludes with future market projections based on demographic participation trends, discretionary spending cycles, marine infrastructure development, technology adoption in propulsion and onboard systems, regional boating culture dynamics, cause-and-effect relationships, and case-based illustrations highlighting the major opportunities and cautions shaping the market through 2035.
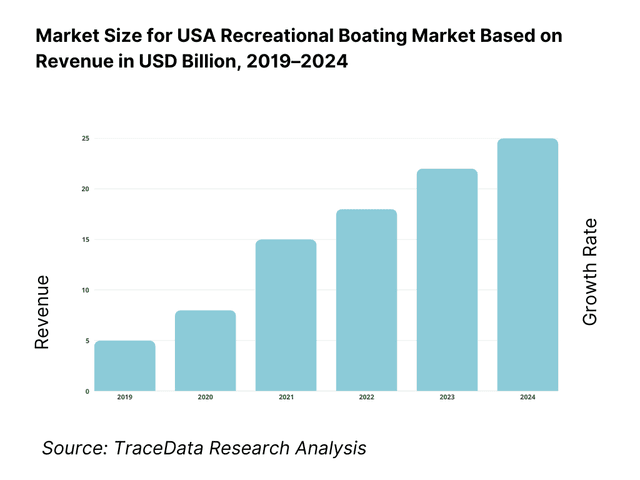
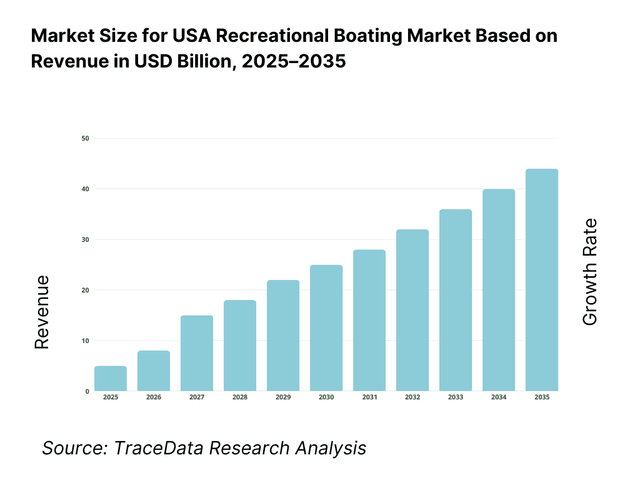
USA Recreational Boating Market Overview and Size
The USA recreational boating market is valued at approximately ~USD ~ billion, representing the sale and usage of leisure watercraft including motorboats, personal watercraft, sailboats, pontoons, fishing boats, and luxury yachts used for personal recreation, sport fishing, cruising, and water-based leisure activities. The market encompasses new boat sales, pre-owned vessels, engines and propulsion systems, accessories, marina services, financing, insurance, and aftermarket maintenance and upgrades.
Recreational boating is deeply embedded in American leisure culture, supported by extensive inland waterways, coastal access, lake systems, and well-developed marina infrastructure. Participation is driven by lifestyle preferences, outdoor recreation trends, and the social appeal of family- and group-oriented water activities. The sector also benefits from strong ancillary spending on fuel, storage, maintenance, dockage, electronics, safety equipment, and marine tourism.
The market is structurally supported by a large installed base of boats requiring periodic replacement, repowering, and refurbishment. Entry-level boats and personal watercraft drive volume, while premium fiberglass boats, offshore fishing vessels, and yachts contribute disproportionately to market value. Seasonal demand patterns, discretionary income sensitivity, and regional boating cultures create distinct sub-markets across the country.
Regionally, the South and the Midwest represent the largest recreational boating markets in the United States. Southern states benefit from year-round or extended boating seasons, strong coastal and inland water access, and high participation in fishing and leisure cruising. The Midwest is anchored by the Great Lakes and a dense network of inland lakes and rivers, supporting strong ownership of pontoons, runabouts, and fishing boats. The West shows high-value demand driven by coastal boating, sport fishing, and luxury segments, though participation is influenced by marina availability, environmental regulations, and cost of ownership. The Northeast market is more seasonal and replacement-driven, with demand concentrated in coastal cruising, sailing, and marina-based boating communities.
What Factors are Leading to the Growth of the USA Recreational Boating Market:
Rising participation in outdoor and water-based recreation strengthens long-term demand: American consumers continue to show strong preference for outdoor, experience-driven leisure activities, particularly those that offer privacy, flexibility, and social interaction. Recreational boating aligns well with these preferences by enabling family outings, fishing, watersports, and coastal cruising without reliance on crowded venues. Increased interest in lifestyle recreation supports both first-time boat ownership and repeat upgrades, especially in entry and mid-sized boat categories.
Demographic shifts and lifestyle upgrades expand the addressable buyer base: Younger households, retirees, and high-income professionals are increasingly participating in boating through ownership, fractional programs, rentals, and boat clubs. Aging baby boomers continue to upgrade into more comfortable and feature-rich boats, while younger buyers enter through personal watercraft, tow boats, and shared-access models. This demographic diversification broadens demand across price tiers and usage profiles.
Technology integration enhances usability, safety, and ownership appeal: Advancements in marine electronics, propulsion systems, hull design, and onboard automation are improving the overall boating experience. Features such as digital navigation systems, integrated infotainment, joystick docking, electric and hybrid propulsion options, and improved safety systems reduce skill barriers and make boating more accessible to new users. These innovations also drive replacement demand as existing owners upgrade to newer platforms.
Which Industry Challenges Have Impacted the Growth of the USA Recreational Boating Market:
Cyclicality of discretionary consumer spending impacts new boat demand and inventory planning: Recreational boating is highly dependent on discretionary household spending, making it sensitive to macroeconomic cycles, interest rate movements, and consumer confidence levels. During periods of economic uncertainty or elevated borrowing costs, potential buyers tend to postpone big-ticket leisure purchases such as boats, particularly in mid-sized and premium segments. This cyclicality creates demand volatility for manufacturers and dealers, complicates inventory planning, and increases exposure to discounting pressure when retail throughput slows. Entry-level boats and personal watercraft tend to be more resilient, but larger cruisers and luxury vessels experience sharper demand corrections during downturns.
High total cost of ownership constrains repeat usage and upgrade cycles: Beyond the initial purchase price, recreational boat ownership involves ongoing costs related to storage, marina fees, fuel, insurance, maintenance, winterization, and repairs. In coastal and urban markets, limited marina capacity and rising dockage fees further elevate ownership costs. These expenses can reduce usage frequency and shorten ownership tenure, particularly among first-time buyers, and may delay upgrade or replacement decisions. As a result, some consumers shift toward shared access, rentals, or boat club models, which can moderate long-term growth in individual ownership even as overall participation increases.
Seasonality and regional weather dependence create uneven utilization and revenue flow: Boating activity in many US regions is highly seasonal, with peak demand concentrated in late spring and summer months. Shorter boating seasons in northern states limit annual usage and reduce perceived value for some buyers, affecting purchase decisions and vessel sizing preferences. For manufacturers, dealers, and service providers, this seasonality leads to uneven revenue flow, workforce utilization challenges, and working capital pressures tied to pre-season inventory buildup. Extreme weather events such as hurricanes, floods, or prolonged droughts can also disrupt boating activity and damage infrastructure, adding uncertainty to regional market performance.
What are the Regulations and Initiatives which have Governed the Market:
Marine safety regulations and vessel compliance standards influencing design and equipment requirements: Recreational boats sold and operated in the United States must comply with safety standards governing flotation, stability, capacity labeling, electrical systems, fuel systems, and mandatory safety equipment. These requirements influence hull design, material selection, onboard systems, and manufacturing processes. Compliance with safety standards increases baseline production costs but also enhances consumer confidence and reduces accident risk. Ongoing updates to safety guidelines require manufacturers to continuously adapt designs and documentation, particularly as boats integrate more electronics and automation features.
Environmental regulations related to emissions, fuel usage, and water protection shaping propulsion choices: Environmental policies aimed at reducing air and water pollution increasingly affect the recreational boating market. Emission standards for marine engines influence engine design, fuel efficiency targets, and the adoption of cleaner propulsion technologies. In certain waterways and inland lakes, restrictions on emissions, noise, or fuel types encourage the use of electric or low-emission propulsion systems. While these initiatives support sustainability goals, they also raise development costs and can limit vessel compatibility in regulated zones, particularly for older boats and legacy engine platforms.
State-level registration, taxation, and boating access policies affecting ownership economics: Recreational boating is governed by a mix of federal, state, and local regulations covering vessel registration, usage fees, taxes, and waterway access. Differences in registration costs, sales tax treatment, and operating rules across states influence ownership economics and cross-border purchasing behavior. Public investment in boating access infrastructures such as ramps, marinas, and navigational maintenance—also plays a role in shaping participation levels. States with supportive access policies and infrastructure funding tend to exhibit stronger boating adoption and higher utilization rates.
USA Recreational Boating Market Segmentation
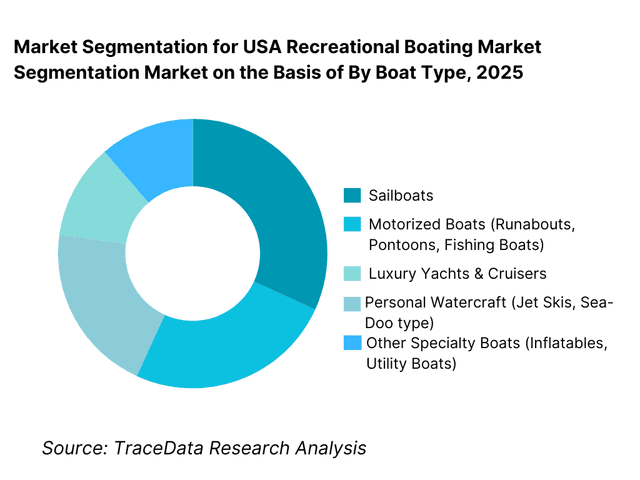
By Boat Type: The motorized recreational boat segment holds dominance in the USA recreational boating market. This is because motorboats—such as runabouts, pontoons, center-console boats, and personal watercraft—offer ease of operation, broad recreational utility, and suitability for both inland and coastal waterways. These boats align well with the preferences of first-time owners, family users, and sport-fishing participants due to lower learning curves, flexible usage profiles, and strong dealer and service network availability. While sailboats and luxury yachts command higher unit values, motorized boats continue to drive overall market volumes due to repeat purchases, upgrades, and wide demographic adoption.
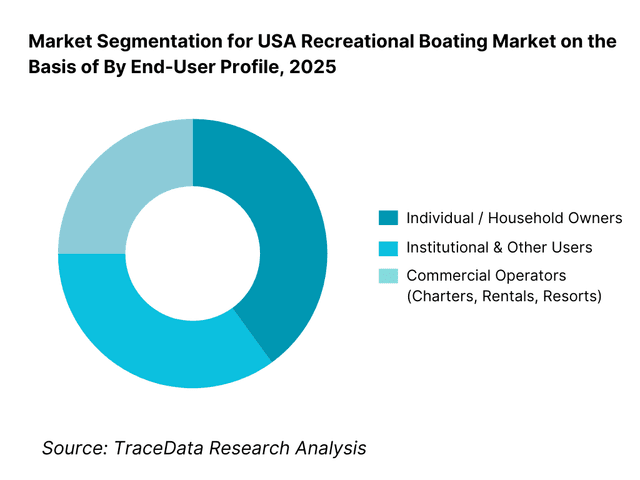
By End-User Profile: Individual recreational users and households account for the majority of boat ownership in the United States. These buyers prioritize leisure, family recreation, fishing, and watersports, and typically purchase entry-to-mid sized vessels. Commercial and institutional users—such as charter operators, resorts, marinas, and rental fleets—represent a smaller but structurally important segment, supporting utilization intensity and aftermarket demand.
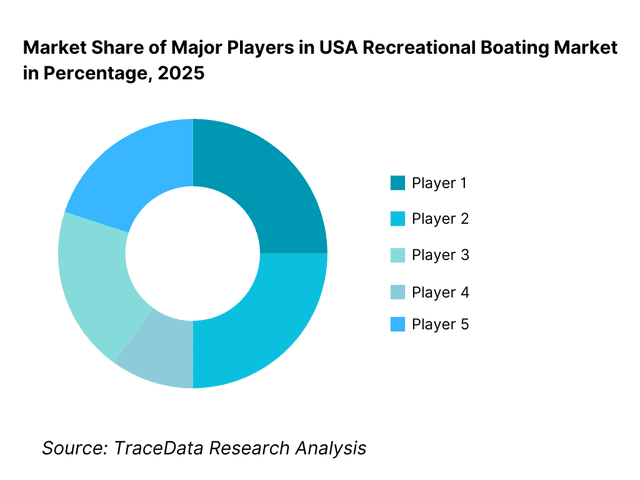
Competitive Landscape in USA Recreational Boating Market
The USA recreational boating market exhibits moderate-to-high concentration, led by a group of large marine manufacturers with diversified product portfolios, vertically integrated engine and component capabilities, and extensive dealer networks. Competitive advantage is driven by brand equity, dealer coverage, financing support, innovation in propulsion and electronics, and after-sales service strength.
Large manufacturers dominate volume-driven segments such as pontoons, runabouts, and personal watercraft, while smaller and specialized builders compete in premium fishing, sailing, and custom yacht segments. Dealer relationships and access to marina-based sales channels remain critical differentiators in customer acquisition and retention.
Name | Founding Year | Original Headquarters |
Brunswick Corporation | 1845 | Mettawa, Illinois, USA |
Yamaha Motor Corporation | 1955 | Iwata, Japan |
Polaris Industries | 1954 | Medina, Minnesota, USA |
BRP | 1942 | Valcourt, Quebec, Canada |
Malibu Boats | 1982 | Loudon, Tennessee, USA |
MasterCraft Boat Holdings | 1968 | Vonore, Tennessee, USA |
Beneteau Group | 1884 | Saint-Gilles-Croix-de-Vie, France |
Marine Products Corporation | 1965 | Atlanta, Georgia, USA |
Some of the Recent Competitor Trends and Key Information About Competitors Include:
Brunswick Corporation: As the largest player in the global recreational boating ecosystem, Brunswick benefits from scale across boat brands, propulsion systems, parts, and digital marine technologies. The company’s competitive strength lies in portfolio breadth, financing support, and its ability to capture aftermarket and service revenue across the boat ownership lifecycle. Brunswick continues to emphasize connectivity, electrification pilots, and dealer-led retail optimization.
Yamaha Motor Corporation: Yamaha remains a dominant force in marine outboard engines and personal watercraft, with strong brand trust around reliability and performance. Its competitive positioning is reinforced by extensive dealer penetration and the ability to bundle engines, controls, and marine electronics. Yamaha’s investments in fuel efficiency and low-emission propulsion enhance its relevance amid tightening environmental scrutiny.
BRP (Sea-Doo): BRP leads the personal watercraft segment through aggressive product innovation, lifestyle branding, and a strong presence in performance and recreational segments. The company continues to expand accessory ecosystems and digital rider experience platforms, supporting higher per-unit revenue and customer engagement.
Malibu Boats and MasterCraft: These companies dominate the premium tow-boat and watersports category, where performance, hull design, wake customization, and brand prestige drive purchasing decisions. Their competitive edge is rooted in continuous product differentiation, strong enthusiast communities, and pricing power within niche but resilient sub-segments.
Beneteau Group: Beneteau maintains a strong position in sailboats and cruising yachts, serving both recreational sailors and charter operators. The company benefits from global scale, design expertise, and exposure to premium leisure boating, although demand remains more sensitive to macroeconomic cycles and marina availability.
What Lies Ahead for USA Recreational Boating Market?
The USA recreational boating market is expected to expand steadily through 2035, supported by sustained interest in outdoor leisure activities, a large and aging installed base of recreational boats, and the gradual broadening of participation through shared access, rentals, and boat club models. Long-term growth will be reinforced by demographic shifts favoring experience-driven consumption, continued investment in marina and waterfront infrastructure, and incremental technology improvements that lower barriers to entry for new users. While short-term demand remains sensitive to discretionary spending cycles, the structural role of boating as a lifestyle and recreational activity underpins stable long-run market expansion.
Transition Toward Experience-Oriented and Feature-Rich Recreational Boats: The future of the US recreational boating market will see a continued shift from basic utility-focused boats toward experience-oriented platforms that emphasize comfort, digital integration, and multi-use functionality. Buyers increasingly seek boats that support a mix of cruising, fishing, watersports, and social activities, driving demand for larger layouts, upgraded seating, integrated entertainment systems, and enhanced onboard amenities. Even in entry and mid-sized segments, expectations around fit-and-finish, electronics, and customization are rising, enabling manufacturers to drive value growth beyond pure unit volume expansion.
Gradual Expansion of Shared Access, Subscription, and Managed Ownership Models: Boat clubs, fractional ownership programs, and subscription-based access models are expected to play a growing role in expanding participation, particularly among urban consumers and younger demographics who value flexibility over asset ownership. These models reduce upfront cost barriers and shift maintenance and storage responsibilities away from users, supporting higher utilization rates. While full ownership will continue to dominate in absolute terms, managed access models will contribute to incremental demand, fleet purchases, and accelerated replacement cycles through professional fleet operators.
Increasing Focus on Propulsion Efficiency, Electrification Pilots, and Environmental Compliance: Environmental considerations will become more prominent in shaping product development and regulatory alignment. While internal combustion engines will remain dominant through 2035, electric and hybrid propulsion solutions are expected to gain traction in inland waterways, pontoons, and regulated water bodies. Manufacturers will increasingly invest in propulsion efficiency, noise reduction, and low-emission technologies to align with evolving environmental standards and consumer expectations. Adoption will be gradual, constrained by range limitations and charging infrastructure, but will represent a strategic growth vector over the forecast period.
Strengthening Role of Dealer Networks, Aftermarket Services, and Lifecycle Revenue: Dealer networks will continue to play a critical role in shaping market outcomes, as buyers place high importance on service access, financing support, and long-term maintenance reliability. Through 2035, competitive advantage will increasingly depend on the ability to capture lifecycle revenue through parts, accessories, repowering, software upgrades, and service contracts. Manufacturers with integrated dealer ecosystems and digital customer engagement platforms will be better positioned to retain customers and smooth revenue cyclicality.
USA Recreational Boating Market Segmentation
By Boat Type
• Motorized Boats (Runabouts, Pontoons, Fishing Boats)
• Personal Watercraft (Jet Skis)
• Sailboats
• Luxury Yachts & Cruisers
• Specialty & Utility Boats
By Propulsion Type
• Internal Combustion Engine (Outboard & Inboard)
• Electric & Hybrid Propulsion
By Ownership / Access Model
• Individual Boat Ownership
• Boat Clubs & Subscription Models
• Rental & Charter Fleets
• Fractional / Shared Ownership
By End-User Profile
• Individual / Household Recreational Users
• Commercial Operators (Charters, Resorts, Rentals)
• Institutional & Other Users
By Region
• South
• Midwest
• West
• Northeast
Players Mentioned in the Report:
• Brunswick Corporation
• Yamaha Motor Corporation
• BRP
• Polaris Industries
• Malibu Boats
• MasterCraft Boat Holdings
• Beneteau Group
• Regional boat manufacturers, dealer networks, marina operators, and marine service providers
Key Target Audience
• Recreational boat manufacturers and component suppliers
• Marine engine and propulsion system providers
• Boat dealers, distributors, and marina-based retailers
• Boat club operators and shared-access platform providers
• Marina owners and waterfront infrastructure developers
• Charter, rental, and marine tourism operators
• Marine insurance and financing companies
• Private equity and leisure-focused investors
Time Period:
Historical Period: 2019–2024
Base Year: 2025
Forecast Period: 2025–2035
Explore Flexible Purchase Options or Have Limited Budget?
Pay only for relevant chapters • Customizable report sections
Table of Contents
Choose individual sections to purchase. Mix and match as you like.
4. 1 Delivery Model Analysis for Recreational Boating-Manufacturer-Dealer, Direct Sales, Boat Clubs, Rentals & Charters [Margins, Preference, Strength & Weakness]
4. 2 Revenue Streams for USA Recreational Boating Market [New Boat Sales, Pre-Owned Boats, Engines & Propulsion, Accessories, Maintenance & Services, Financing & Insurance]
4. 3 Business Model Canvas for USA Recreational Boating Market [Key Partners, Key Activities, Value Propositions, Customer Segments, Cost Structure, Revenue Streams]
5. 1 Local Boat Builders vs Global Marine Brands [Regional Boat Builders vs Brunswick/Yamaha/BRP etc.]
5. 2 Investment Model in USA Recreational Boating Market [Private Equity, Corporate Investments, Marina Infrastructure Funding, OEM Capex]
5. 3 Comparative Analysis of Recreational Boating Adoption in Individual vs Commercial Users [Ownership Models, Usage Patterns, ROI Benchmarks]
5. 4 Boating Spend Allocation by Consumer Segment [Entry-Level Owners, Mid-Segment Owners, Premium & Luxury Owners]
8. 1 Revenues (Historical Trend)
9. 1 By Market Structure (Owned Boats vs Shared Access / Rentals)
9. 2 By Boat Type (Motorboats, Personal Watercraft, Sailboats, Yachts)
9. 3 By End-User Profile (Individual Users, Commercial Operators, Institutional Users)
9. 4 By Ownership Model (Full Ownership, Boat Clubs, Rental & Charter, Fractional Ownership)
9. 5 By Usage Type (Leisure Cruising, Fishing, Watersports, Luxury Recreation)
9. 6 By Propulsion Type (ICE, Electric & Hybrid)
9. 7 By New vs Pre-Owned Boats
9. 8 By Region (South, Midwest, West, Northeast)
10. 1 Consumer & Commercial Buyer Landscape and Cohort Analysis
10. 2 Boating Adoption Drivers & Decision-Making Process
10. 3 Usage Intensity & Value-for-Money Analysis
10. 4 Gap Analysis Framework
11. 1 Trends & Developments in USA Recreational Boating Market
11. 2 Growth Drivers for USA Recreational Boating Market
11. 3 SWOT Analysis for USA Recreational Boating Market
11. 4 Issues & Challenges for USA Recreational Boating Market
11. 5 Government Regulations for USA Recreational Boating Market
12. 1 Market Size and Future Potential for Boat Clubs & Rentals in USA
12. 2 Business Models & Revenue Streams [Subscriptions, Hourly Rentals, Membership Fees]
12. 3 Delivery Models & Boating Services Offered [Boat Clubs, Marina-Based Rentals, Luxury Charters]
15. 1 Market Share of Key Players in USA Recreational Boating Market (By Revenues)
15. 2 Benchmark of Key Competitors [Company Overview, USP, Business Strategies, Business Model, Manufacturing Capacity, Revenues, Pricing Strategy, Technology Used, Best-Selling Boat Models, Dealer Network, Strategic Tie-ups, Marketing Strategy, Recent Developments]
15. 3 Operating Model Analysis Framework
15. 4 Gartner Magic Quadrant for Marine & Recreational Boat Manufacturers
15. 5 Bowman’s Strategic Clock for Competitive Advantage
16. 1 Revenues (Projections)
17. 1 By Market Structure (Owned Boats vs Shared Access Models)
17. 2 By Boat Type (Motorboats, Personal Watercraft, Sailboats, Yachts)
17. 3 By End-User Profile (Individual, Commercial, Institutional)
17. 4 By Ownership Model (Full Ownership, Boat Clubs, Rental & Charter)
17. 5 By Usage Type (Leisure, Fishing, Watersports, Luxury)
17. 6 By Propulsion Type (ICE, Electric & Hybrid)
17. 7 By New vs Pre-Owned Boats
17. 8 By Region (South, Midwest, West, Northeast)
Discuss a Customized Research Scope
Custom research scope • Tailored insights • Industry expertise
Research Methodology
Step 1: Ecosystem Creation
We begin by mapping the complete ecosystem of the USA Recreational Boating Market across demand-side and supply-side entities. On the demand side, entities include individual recreational boat owners, sport fishing enthusiasts, watersports participants, luxury leisure consumers, charter and rental operators, boat clubs, resorts, and marina-based commercial users. Demand is further segmented by boat type (motorboats, personal watercraft, sailboats, yachts), usage profile (family recreation, fishing, watersports, cruising), ownership model (full ownership, shared access, rental, subscription), and waterbody access (coastal, inland lakes, rivers).
On the supply side, the ecosystem includes recreational boat manufacturers, personal watercraft producers, marine engine and propulsion suppliers, component and electronics providers, boat dealers and distributors, marina operators, maintenance and service providers, financing and insurance companies, and regulatory and safety bodies overseeing vessel compliance and waterway usage. From this mapped ecosystem, we shortlist 8–12 leading manufacturers and a representative set of regional dealers based on product portfolio breadth, dealer network reach, brand equity, service capability, and exposure across volume and premium boat segments. This step establishes how value is created and captured across boat design, manufacturing, distribution, usage, servicing, and lifecycle monetization.
Step 2: Desk Research
An exhaustive desk research process is undertaken to analyze the structure, demand drivers, and behavioral dynamics of the USA recreational boating market. This includes reviewing participation trends in outdoor recreation, boat registration patterns, marina capacity development, waterfront infrastructure investment, and discretionary spending cycles influencing big-ticket leisure purchases. We assess buyer preferences related to boat size, propulsion type, usage frequency, financing options, and total cost of ownership.
Company-level analysis includes review of manufacturer product offerings, brand positioning, dealer network strategies, propulsion technology roadmaps, and aftermarket service models. Regulatory and safety dynamics are examined at both federal and state levels, including emissions standards, safety equipment requirements, and waterbody-specific operating restrictions. The outcome of this stage is a robust industry foundation that defines segmentation logic and supports assumption building for market estimation and long-term outlook modeling.
Step 3: Primary Research
We conduct structured interviews with recreational boat manufacturers, personal watercraft producers, marine engine suppliers, boat dealers, marina operators, charter and rental fleet owners, and experienced boat owners. The objectives are threefold: (a) validate assumptions around demand concentration by boat type and region, (b) authenticate segment splits by ownership model, propulsion type, and end-user profile, and (c) gather qualitative insights on pricing behavior, inventory turnover, dealer margins, financing penetration, and consumer expectations related to technology, reliability, and service support.
A bottom-to-top approach is applied by estimating unit sales and average realized value across key boat categories and regions, which are aggregated to develop the overall market view. In selected cases, disguised buyer-style interactions are conducted with dealers and marina-based sellers to validate field-level realities such as availability lead times, seasonal discounting patterns, service backlogs, and common ownership pain points.
Step 4: Sanity Check
The final stage integrates bottom-to-top and top-to-down approaches to cross-validate market sizing, segmentation splits, and forecast assumptions. Demand estimates are reconciled with macro indicators such as household income trends, leisure spending patterns, outdoor recreation participation rates, and marine infrastructure investment levels. Assumptions around seasonality, fuel cost sensitivity, and financing availability are stress-tested to understand their impact on purchase decisions and replacement cycles.
Sensitivity analysis is conducted across key variables including discretionary spending growth, adoption of shared access models, propulsion technology shifts, and regulatory tightening in environmentally sensitive waterways. Market models are refined until alignment is achieved between manufacturer capacity, dealer throughput, marina utilization, and end-user participation trends, ensuring internal consistency and robust directional forecasting through 2035.
See What's Inside the Report
Get a preview of key findings, methodology and report coverage
Frequently Asked Questions
The USA recreational boating market holds strong long-term potential, supported by a large and engaged boating population, sustained interest in outdoor and experience-driven leisure activities, and a substantial installed base requiring replacement, repowering, and upgrades. While demand remains cyclical in the short term due to discretionary spending sensitivity, structural drivers such as demographic diversification, shared access models, and technology-enabled usability improvements are expected to support steady growth through 2035.
The market features a combination of large diversified marine manufacturers with multi-brand portfolios and extensive dealer networks, alongside specialized builders focused on fishing, watersports, sailing, and luxury segments. Competition is shaped by brand equity, dealer reach, product innovation, financing support, and after-sales service capability. Dealer networks and marina-based retail presence play a central role in customer acquisition, service delivery, and lifecycle revenue capture.
Key growth drivers include rising participation in water-based recreation, expanding marina and waterfront infrastructure, increasing adoption of feature-rich and technology-enabled boats, and the emergence of shared access and subscription models that lower entry barriers. Replacement and repowering demand from the aging installed base, along with gradual adoption of efficient and low-emission propulsion technologies, further supports market expansion.
Challenges include sensitivity to economic cycles, high total cost of ownership, seasonal utilization patterns, and regional constraints related to marina availability and water access. Environmental regulations and fuel price volatility can influence operating costs and propulsion choices, while skilled labor availability in manufacturing and servicing can impact lead times and service quality in peak seasons.
License Options
PDF + Excel
Complete report package
$4,000
Excel Only
Data and analytics
$2,500
Custom Sections
Starts from $100
$0