Australia Logistics and Supply Chain Management Market Outlook to 2029
By Market Structure, By Key Segments, By Service Providers, By Technology Adoption, By Industry Verticals, and By Region
Report Overview
Report Code
TDR0108
Coverage
Asia
Published
December 2024
Pages
80-100
Flexible Purchase Options
Select and purchase only the chapters you need for your strategic decisions
On This Page
Report Overview
The report titled “Australia Logistics and Supply Chain Management Market Outlook to 2029 - By Market Structure, By Key Segments, By Service Providers, By Technology Adoption, By Industry Verticals, and By Region” provides a comprehensive analysis of the logistics and supply chain management market in Australia. The report covers an overview and genesis of the industry, overall market size in terms of revenue, market segmentation; trends and developments, regulatory landscape, customer level profiling, issues and challenges, and comparative landscape including competition scenario, cross-comparison, opportunities and bottlenecks, and company profiling of major players in the logistics and supply chain management market.
Report Coverage
Verified Market Sizing
Multi-layer forecasting with historical data and 5–10 year outlook
Deep-Dive Segmentation
Cross-sectional analysis by product type, end user, application and region
Competitive Benchmarking & Positioning
Market share, operating model, pricing and competition matrices
Actionable Insights & Risk Assessment
High-growth white spaces, underserved segments, technology disruptions and demand inflection points
Review Methodology & Data Structure
Preview report structure, data sources and research framework
Executive Summary
The report titled “Australia Logistics and Supply Chain Management Market Outlook to 2029 - By Market Structure, By Key Segments, By Service Providers, By Technology Adoption, By Industry Verticals, and By Region” provides a comprehensive analysis of the logistics and supply chain management market in Australia. The report covers an overview and genesis of the industry, overall market size in terms of revenue, market segmentation; trends and developments, regulatory landscape, customer level profiling, issues and challenges, and comparative landscape including competition scenario, cross-comparison, opportunities and bottlenecks, and company profiling of major players in the logistics and supply chain management market. The report concludes with future market projections based on revenue, by market segments, service types, region, cause and effect relationship, and success case studies highlighting major opportunities and potential risks.
Australia Logistics and Supply Chain Management Market Overview and Size
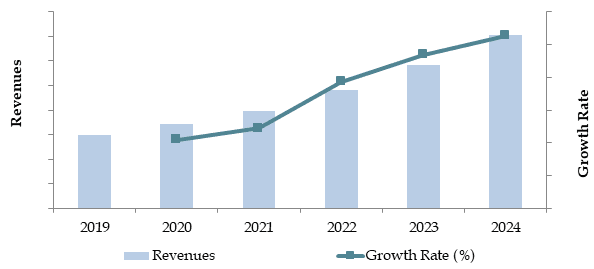
This increasing traction for e-commerce, development in infrastructure, and high demand for fast-moving logistics performance across industries took the valuation of the Australia Logistics and Supply Chain Management market to AUD 120 Billion by 2023. The leading players within this marketplace have been distinctly marked by appropriate distribution networks, innovative range of services, and highly customer-centric business solutions. This has been appropriately shown in Toll Group, Linfox, DHL, Australia Post, and DB Schenker.
DHL entered the Australian market in 2023 by releasing advanced warehousing automation solutions to enable operational efficiencies and meet rising demand for the fulfillment of e-commerce contracts. Due to proximity to major industrial clusters with well-established logistics infrastructure, major hubs such as Sydney, Melbourne, and Brisbane will be included among the key markets.
Market Size for Australia Logistics and Warehousing Market Basis Revenues in USD Billion, 2018-2024
Factors Driving Growth in the Australian Logistics and SCM Market
Economic Factors: Growth in e-commerce, investment in infrastructures, and other geo-strategist positioning of the nation, as it often acts and can be utilized as the ideal gateway within the Asia-Pacific hemisphere of the 21st Century driven demand for logistics operations really hard within an extremely minimal range. Online-based e-commerce accounted for close to approximately 20 percent of combined sales in retailing alone about Australia through the year of 2023, compelling both effective and also expansive supply-chain-related solutions.
Technology Adoption: Advanced technologies such as AI, IoT, and blockchain are changing the outlook of the logistics landscape. About 45% of the logistics providers in Australia have been able to apply AI-driven analytics for route optimization to reduce time and increase customer satisfaction in the year 2023.
Industry Vertical Demand: Large industry verticals such as retail, healthcare, and manufacturing have witnessed vast growth that demands customized solutions regarding supply chain demand. The cold chain logistics related to pharmaceuticals and vaccines of the healthcare sector have been in great demand.
Which industry challenges are influencing the growth prospect for Australia logistics and supply chain management market?
- Infrastructure Bottlenecks: Despite the broad network of transport that Australia enjoys, congestion in urban ports and a general lack of rail connectivity are just some of the infrastructure shortcomings in regional areas. The unintended consequence is that industries dependent on bulk shipments have longer transit times and costs. In 2023, logistics costs for rural areas were forecasted to be 25% higher than in urban centers.
Increasing Operational Costs: Unpredictable fuel prices and growth in labor expenses are some reasons affecting the profitability of service logistics providers. It is reflected in the studies released by the Australian Logistics Council stating that operational costs this 2023 rose by approximately 12% and were driven by elevated fuel prices and inflexible requirements surrounding wage compensation.
Barriers to the Adoption of Technology: The adoption of advanced technologies related to automation and real-time tracking systems has been quite difficult for these small and medium-sized logistics companies due to the high cost of implementation. In this regard, a survey conducted in the 2023-year showed that there was only 38% SME participation in the logistic sector related to the integration of digital supply chain solutions.
Environmental Regulations: With stringent environmental policies concerning the reduction of emissions and associated fines for the same, the going is getting tougher for logistics operators. The compliance cost related to upgrading their fleets to keep up with the standards has seen a rise of 15% YoY as reported in 2023.
Regulations and Initiatives that Governed the Market
National Freight and Supply Chain Strategy: This was started by the Australian government in its quest to create an efficient and sustainable logistics industry. Included herein is investment in intelligent freight systems and building intermodal transport nodes. In 2023, the government pledged AU$10 billion to go toward the renewal of logistics infrastructure within this scheme.
Emission Reduction Targets: The Government of Australia calls for logistics operators to reduce carbon emissions by 30% until 2030 under the NGERS. Due to these regulations, investments in clean fuel technologies and electric fleet vehicles have increased considerably.
Customs Modernization Act: Improved the importation and exportation process. The act simplifies customs clearance, hence reducing delay times across all international logistics. In 2023, processing times were reduced by 20% as compared to the previous year 2022, improving the cross-border trade.
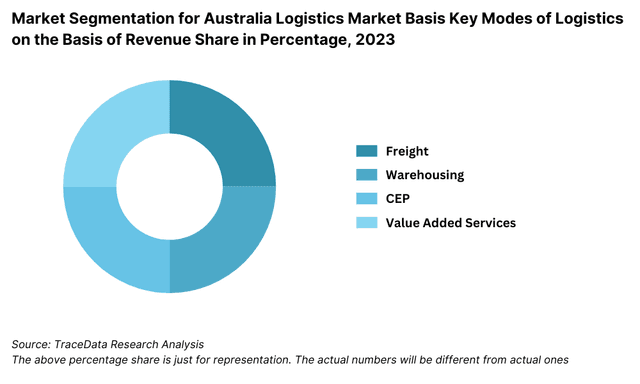
Australia Logistics and Supply Chain Management Market Segmentation
By Key Segments: Road transport segment occupies the leading category in the logistics market, due to dependency on highways for interstate and regional freight movements. Next is rail logistics, mainly in the mining and agro-based industries, where bulk goods are moved over long distances. Air and sea logistics are mainly used in foreign trade, whereby sea freights handle the largest share of imports and exports.
By Technology Adoption: Technology adoptions such as fleet management systems, real-time tracking, and automation are fast changing the face of the industry. An estimated 65% of large freight logistics firms in Australia have already adopted advanced technology to enhance operational efficiency and lower operations costs, while smaller players are increasingly investing in affordable technology solutions as a survival strategy.
Competitive Landscape in Australia Logistics and Supply Chain Management Market
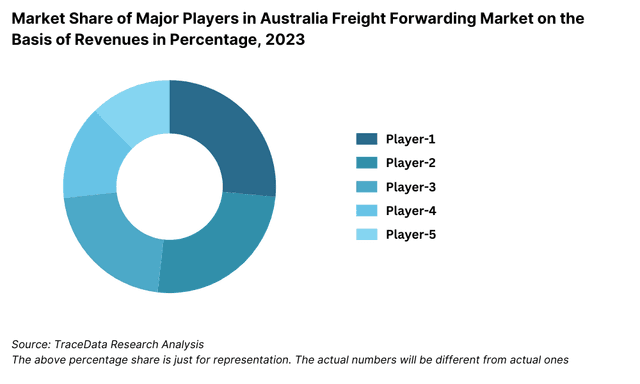
The nature of concentration in the Australian logistics and supply chain management market is believed to be at a relatively concentrated stage because big companies include Toll Group, Linfox, DHL, and FedEx. It also recorded considerable development on behalf of new up-and-coming players and technological start-ups focused on value-added services related to last-mile delivery and warehouse automation.
Company Name | Establishment Year | Headquarters |
|---|---|---|
Linfox | 1956 | Melbourne, Australia |
Toll Group | 1888 | Melbourne, Australia |
DB Schenker | 1872 | Essen, Germany |
DHL Group | 1969 | Bonn, Germany |
Mainfreight | 1978 | Auckland, New Zealand |
Australia Post | 1809 | Melbourne, Australia |
FedEx Australia | 1971 | Memphis, USA |
UPS Australia | 1907 | Atlanta, USA |
Qube Holdings | 2006 | Sydney, Australia |
Kuehne + Nagel | 1890 | Schindellegi, Switzerland |
TNT Express | 1946 | Hoofddorp, Netherlands |
CEVA Logistics | 2007 | Marseille, France |
Aramex Australia | 1982 | Dubai, UAE |
Northline | 1983 | Adelaide, Australia |
Sadleirs Logistics | 1895 | Perth, Australia |
SCT Logistics | 1974 | Melbourne, Australia |
Linx Cargo Care Group | 2016 | Sydney, Australia |
Centurion | 1971 | Perth, Australia |
Silk Contract Logistics | 2012 | Melbourne, Australia |
VISA Global Logistics | 1982 | Sydney, Australia |
Some of the recent competitor trends and key information about competitors include:
Toll Group: Toll Group still restrains its position as a market leader through the extensive network and advanced developments in logistics technology. In 2023, the company finally announced a partnership drive with several e-commerce platforms, which resulted in smoothing last-mile delivery services, ultimately increasing by up to 12% of delivery efficiency.
Linfox: With its strong presence in FMCG and retail, Linfox recorded a 10% increase in revenue in 2023. The company has invested heavily in green logistics, including electric delivery vehicles, aligning with Australia's Sustainable Development Goals, thus further cementing its lead in the market.
DHL: The German-based international giant has recorded a 15% growth in 2023 on the back of increasing operations in Australia due to demand for international freight and customized supply chain solutions across healthcare and technology verticals. With the launching of its automated Sydney warehouse, DHL would get more efficiency at lower costs.
FedEx: FedEx, specialized in express logistics, saw an increase of 20% in its international shipments related to FedEx in Australia by 2023, including improved air freight services in regional areas. These industries make increasing usage of such services where delivery time is critical.
Mainfreight: It heavily focuses on delivering intermodal road transport solutions for its customers: in 2023, Mainfreight expanded farther into Australia with added distribution centers in the cities of both Brisbane and Perth. The transportation company also presented AI-powered methods for route improvements, which cut on-road delivery hours by 8%.
What Awaits Australia Logistics and Supply Chain Management Market?
The logistics and supply chain management market in Australia is expected to show stable growth by 2029, recording a consistent CAGR throughout the forecast period. Growth in the market will be witnessed due to technological advancements, increased e-commerce activities, and a sharp focus on sustainability and efficiency enhancement across the sector.
Shift to Green Logistics: Australia has vowed to reach net-zero emissions by 2050, so the implication for the wider logistical industry-to look at greener alternatives of going electric-stands to reason. Besides, government initiatives and the rapidly growing consumer appetite for cleaner environments will create avenues for even newer ways through this transition.
Advanced Technologies Integration: Artificial intelligence, blockchain, and the Internet of Things will be used in supply chain management, further enhancing operational efficiency and transparency. These innovations will make operations seamless, less costly, and more efficient, with better decision-making due to analytics in real time.
- Growth of E-commerce-driven Logistics: Growth in last-mile delivery solutions, fulfillment centers, and automation technologies will be driven by increasing demand from the growing e-commerce. Innovations within the delivery model increasingly involve a focus on drone deliveries and smart lockers to achieve the requirements around speed and convenience expected by an increasing number of consumers.
Development of Intermodal Transport: This investiture at intermodal hub and freight corridor programs given by the Australian government will foster the integration that exists among various modes of travel, including high seas, through roadways as well as their rail network systems. Such transit development is to be expected-with reduced time consuming, lower operational costs, thereby increasing the accuracy of the transported things for long distance or international freight.
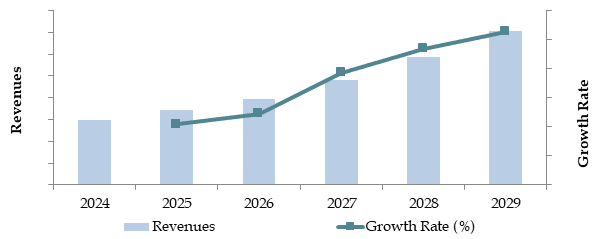
Future Outlook and Projections for Australia Logistics and Warehousing Market on the Basis of Revenues in USD Billion, 2024-2029
Australia Logistics and Supply Chain Management Market Segmentation
Freight Forwarding Market
By Mode of Transportation
- Road Freight (Fleets, Volume, FTK, Price/ton/km and Revenue)
- Sea Freight (Fleets, Volume, Average Distance, Price/ton/km and Revenue)
- Air Freight (Volume, Average Distance, Price/ton/km and Revenue)
- By Road transportation
- Less than Truck load (Revenue and Volume)
- Full truck load (Revenue and Volume)
- By End Users (Revenues)
- Food & Beverages
- Textiles and Footwear
- Chemicals
- Pharmaceuticals and Medical consumables
- Electronics
- Others include agricultural products, frozen meat and more
Warehousing Market
By Business Model (Revenue, Price/sqm, warehousing space, Occupancy rate)
Industrial/Retail
CFS/ICD
Cold Storage
Agriculture
By Industrial warehouses (Revenues)
Grade A
Grade B
Grade C and others
By End Users (Revenues)
Food & Beverages
Textiles and Footwear
Chemicals
Pharmaceuticals and Medical consumables
Electronics
Others include agricultural products, frozen meat and more
CEP Market
By Channel
3PL Players
E-Commerce Merchants
By Type of Shipments
Domestic Shipments
International Shipments
By Area of Delivery
Intercity
Intracity
By Mode
Air Shipments
Ground Shipments
By Delivery Period
Same Day Delivery
1-2 Day Delivery
3-4 Day Delivery
More than 4 Day Delivery
By Type of Products
Consumer Electronics & Media
Fashion & Accessories
Foods & Personal Care
Home Care & Furniture
Toys & Baby Products
Others (Video Games, Digital Music, Pet Care, Home Gardening, etc.)
- By Region:
- New South Wales
- Victoria
- Queensland
- Western Australia
- South Australia
- Tasmania
Players Mentioned in the Report:
- Linfox
- Toll Group
- DB Schenker
- DHL Group
- Mainfreight
- Australia Post
- FedEx Australia
- UPS Australia
- Qube Holdings
- Kuehne + Nagel
- TNT Express
- CEVA Logistics
- Aramex Australia
- Northline
- Sadleirs Logistics
- SCT Logistics
- Linx Cargo Care Group
- Centurion
- Silk Contract Logistics
- VISA Global Logistics
Key Target Audience:
- Logistics Service Providers
- Technology Solution Providers
- Government and Regulatory Bodies (e.g., Australian Logistics Council)
- Industry Associations and Advocacy Groups
- E-commerce and Retail Companies
- Infrastructure Development Authorities
Time Period:
- Historical Period: 2018-2023
- Base Year: 2024
- Forecast Period: 2024-2029
Explore Flexible Purchase Options or Have Limited Budget?
Pay only for relevant chapters • Customizable report sections
Table of Contents
Choose individual sections to purchase. Mix and match as you like.
4.1. Macroeconomic framework for Australia Including GDP (2018-2024), GDP Growth (2018-2024), GDP Contribution by Sector
4.2. Logistics Sector Contribution to GDP and how the contribution has been changing in the historical assessment
4.3. Ease of Doing Business in Australia
4.4. LPI Index of Australia and Improvements in the last 10-15 Years
4.5. Custom Procedure and Custom Charges in Australia Logistics market
5.1. Landscape of Investment Parks and Free Trade Zones in Australia
5.2. Current Scenario for Logistics Infrastructure in Australia
5.3. Road Infrastructure in Australia including Road Network, Toll Charges and Toll Network, Major Goods Traded through Road, Major Flow Corridors for Road (Inbound and Outbound)
5.4. Air Infrastructure in Australia including Total Volume Handled, FTK for Air Freight, Major Inbound and Outbound Flow Corridors, Major Goods traded through Air, Number of Commercial and passenger Airports, Air Freight Volume by Ports and other Parameters
5.5. Sea Infrastructure in Australia including Total Volume Handled, FTK for Sea Freight, Major Inbound and Outbound Flow Corridors, Major Goods Traded through Sea, Number of Ports for Coastal and Ocean Freight, Number of Vessels, Sea Freight Volume by Ports and other Parameters
5.6. Rail Infrastructure in Australia including Total Volume Handled, FTK for Rail Freight, Major Inbound and Outbound Flow Corridors, Major Goods Traded through Rail and others
6.1. Basis Revenues, 2018-2024P
7.1. By Segment (Freight Forwarding, Warehousing, CEP and Value-Added Services), 2018-2024P
7.2. By End User Industries, 2018-2024P
8.1. Market Overview and Genesis
8.2. Australia Freight Forwarding Market Size by Revenues, 2018-2024P
8.3. Australia 3PL Freight Forwarding Market Segmentation, 2018-2024P
8.3.1. By Mode of Freight Transport (Road, Sea, Air and Rail), 2018-2024P
8.3.1.1. Price per FTK for Road/Air/Sea and Rail in Australia
8.3.1.2. Road Freight (Domestic and International Volume, FTK and Revenue; Number of Registered Vehicles)
8.3.1.3. Road Freight Domestic and International Corridors
8.3.1.4. Ocean Freight (Domestic and International Volume, FTK and Revenue; Volume by Commodity; Sea Ports Key Statistics)
8.3.1.5. Air Freight (Domestic and International Volume, FTK and Revenue)
8.3.1.6. Rail Freight (Domestic and International Volume, FTK and Revenue; Volume by Commodity and Region)
8.3.1.7. Export-Import Scenario (Value by Mode of Transport, Commodity and Country; Volume by Principal Commodities)
8.3.2. By Intercity Road Freight Corridors, 2018-2024P
8.3.3. By International Road Freight Corridors, 2018-2024P
8.3.4. By End User (Industrial, FMCG, F&B, Retail and Others), 2018-2024P
8.4. Snapshot of Freight Truck Aggregators in Australia Including Company Overview, USP. Business Strategies, Future Plans, Business Model, Number of Fleets, Margins/Commission, Number of Booking, Major Clients, Average Booking Amount, Major Routes and others
8.5. Competitive Landscape in Australia Freight Forwarding Market, 2021
8.5.1. Heat Map of Major Players in Australia Freight Forwarding on the Basis of Service offering
8.5.2. Market Share of Maior Players in Australia Freight Forwarding Market, 2023
8.5.3. Cross Comparison of Major Players in Freight Forwarding Companies on the Basis of Parameters including Volume of Road Freight, Inception Year, Number of Fleets (Owned and Subcontracted), Fleets by Type, Occupancy Rate, Number of Employees, Major Route Network, Major Clients, Revenues, Volume of Sea Freight, Volume of Air Freight, USP, Business Strategy, Technology, (2023)
8.6. Australia Freight Forwarding Future Market Size by Revenues, 2025-2029
8.7. Australia Freight Forwarding Market Segmentation, 2025-2029
8.7.1. Future Market Segmentation by Mode of Freight Transport (Road, Sea, Air and Rail), 2025-2029
8.7.2. Future Market Segmentation by International Road Freight Corridors (China, Thailand and India), 2025-2029
8.7.3. Future Market Segmentation by End User (Industrial, FMCG, F&B, Retail and Others), 2025-2029
9.1. Market Overview and Genesis
9.2. Value Chain Analysis in Australia Warehousing Market including entities, margins, role of each entity, process flow, challenges and other aspects
9.3. Australia Warehousing Market Size on the Basis of Revenues and Warehousing Space, 2018-2024P
9.4. Australia Warehousing Market Segmentation
9.4.1. Australia Warehousing Revenue by Business Model (Industrial/Retail, ICD/CFS and Cold Storage), 2018-2024P
9.4.2. Australia Warehousing By Type of Warehouse (General, Open Yard, Freezer/Chiller, Ambient and Bonded Warehouses), 2018-2024P
9.4.3. Australia Warehousing Revenue by End User (Industrial & Construction, FMCG, Retail, Food & Beverage and Others), 2018-2024P
9.4.4. 3PL Warehousing Space by Region, 2024P
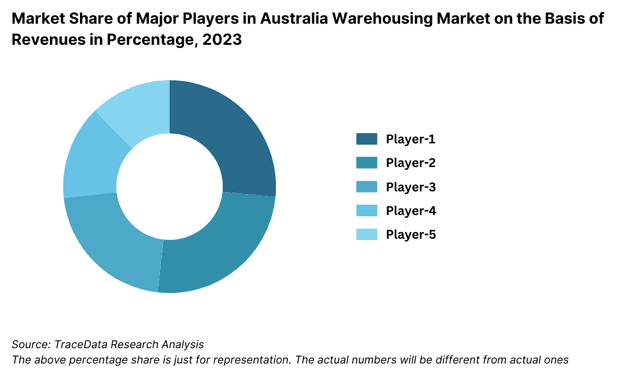
9.5. Competitive Landscape in Australia Warehousing Market
9.5.1. Market share of Top 10 Companies in Australia Warehousing Market, 2023
9.5.2. Cross Comparison of Top 10 Warehousing Companies on the Basis of Parameters including Company Overview, USP, Business Strategy, Future Plans, Technology, Revenues from Warehousing, Number of Warehouses, Warehousing Space, Location of Warehouses, Type of Warehouses, Occupancy Rate, Rental Rates, Clients and others, (2023)
9.6. Australia Warehousing Future Market Size on the Basis of Revenues, 2025-2029
9.7. Australia Warehousing Market Future Segmentation
9.7.1. Australia Warehousing Revenue by Business Model (Industrial/Retail, ICD/CFS and Cold Storage), 2025-2029
9.7.2. Australia Warehousing Revenue By Type of Warehouse (General, Open Yard, Freezer/Chiller, Ambient and Bonded Warehouses), 2025-2029
9.7.3. Australia Warehousing Revenue by End User (Industrial & Construction, FMCG, Retail, Food & Beverage and Others), 2025-2029
10.1. Market Overview and Genesis
10.2. Value Chain Analysis in Australia CEP Market including entities, margins, role of each entity, process flow, challenges and other aspects
10.3. Revenue Composition and Contribution Between First Mile/Mid Mile and Last Mile Delivery-Analysis for Domestic and International Shipments
10.4. Australia CEP Market Size on the Basis of Revenues and Shipments, 2018-2024P
10.5. Australia CEP Market Segmentation, 2021
10.5.1. Segmentation by Mails and Documents, E-Commerce Shipments and Express Cargo, 2023-2024P
10.5.2. Segmentation by International and Domestic Express, 2023-2024P
10.5.3. Segmentation by B2B, B2C and C2C, 2023-2024P
10.5.4. Segmentation by Period of Delivery, 2023-2024P
10.6. Competitive Landscape in Australia CEP Market, 2021
10.6.1. Overview and Genesis, Market Nature, Market Stage and Major Competing Parameters
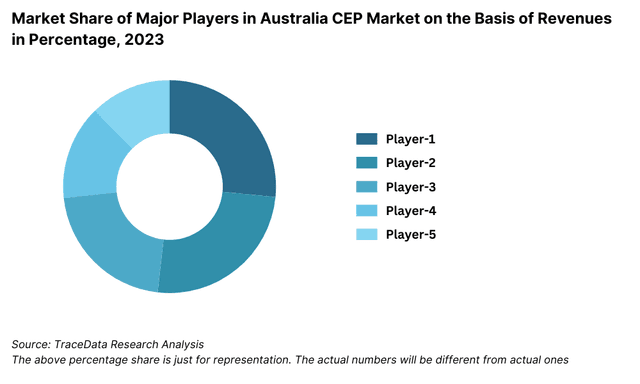
10.6.2. Market Share of Companies in Australia CEP Market on the Basis of Revenues/Number of Shipments, 2023
10.6.3. Market Share of Top 5 Companies in Australia E-Commerce Shipment Market on the Basis of Revenues/Number of Shipments, 2023
10.6.4. Cross Comparison of Top 10 Australia CEP Companies on the Basis of Parameters including Company Overview, USP, Business Strategy, Future Plans, Technology, Number of last Mile Delivery Shipments, Revenues, Major Clients, Number of Fleets, Number of Employees, Number of Riders, Number of Pin Code Served, Major Service Offering and others
10.7. Australia CEP Market Size on the Basis of Revenues and Shipments, 2025-2029
10.8. Australia CEP Market Segmentation
10.8.1. Segmentation by Mails and Documents, E-Commerce Shipments and Express Cargo, 2025-2029
10.8.2. Segmentation by International and Domestic Express, 2025-2029
10.8.3. Segmentation by B2B, B2C and C2C, 2025-2029
10.8.4. Segmentation by Period of Delivery, 2025-2029
11.1. Customer Cohort Analysis and End User Paradigm for Different Industry Verticals under Logistics Sector (Telecommunications, FMCG, Automotive, Apparel, F&B, Construction and Pharmaceuticals)
11.2. Understanding on Logistics Spend by End User, 2023-2024P
11.3. End User Preferences in terms of In-House or Outsourcing Logistics Services and Reason for Selection; Segregate this by Size of Company on the Basis of Revenues
11.4. Major Logistics Company who are Specialized in Serving Each Type of End User (Telecommunications, FMCG, Apparel, F&B, Construction and Pharmaceuticals)
11.5. Detailed Landscape of Each End Users across Parameters including Major Products Manufactured and Traded, Emerging Products, Type of Services Required, and Type of Services Outsourced, Major Companies, Contract Duration, Likelihood to Recommend, Market Orientation, Major Clusters, Type of Sourcing Preference, Pain Points, Facilities/Services Required, Future Outlook. Market Size for End User Industry Vertical with Growth Rate, 2018-2024P
12.1. Basis Revenues, 2025-2029
13.1. By Segment (Freight Forwarding, Warehousing, CEP and Value-Added Services), 2025-2029
13.2. By End User Industries, 2025-2029
13.3. Recommendation
13.4. Opportunity Analysis
Discuss a Customized Research Scope
Custom research scope • Tailored insights • Industry expertise
Research Methodology
Step 1: Ecosystem Creation
Map the ecosystem and identify all the demand-side and supply-side entities for the Australia Logistics and Supply Chain Management Market. Based on this ecosystem, we shortlist the leading 5-6 service providers in the country, focusing on their financial information, operational scale, and market share.
Initial sourcing is conducted using industry reports, articles, and multiple secondary and proprietary databases to gather key industry-level information.
Step 2: Desk Research
Perform comprehensive desk research to reference diverse secondary and proprietary databases. This enables a detailed analysis of the market, aggregating industry insights, including revenue, number of players, pricing trends, and demand patterns.
Review company-level data using press releases, annual reports, financial statements, and market filings to establish a foundational understanding of market dynamics and participant performance.
Step 3: Primary Research
Conduct in-depth interviews with C-level executives and other stakeholders across various segments of the Australia Logistics and Supply Chain Management Market. These interviews aim to validate market hypotheses, authenticate statistical data, and gather operational and financial insights.
A bottom-to-top approach is used to evaluate service volumes for individual providers, which are aggregated to determine the overall market size.
Validation processes include disguised interviews where companies are approached as potential customers to verify operational and financial information. This method ensures accuracy by comparing shared data against secondary sources.
Step 4: Sanity Check
- Undertake bottom-to-top and top-to-bottom analysis along with market size modeling exercises to perform a final sanity check of the market estimates and projections.
See What's Inside the Report
Get a preview of key findings, methodology and report coverage
Frequently Asked Questions
The Australia Logistics and Supply Chain Management Market is poised for significant growth, driven by the rapid expansion of e-commerce, rising technological integration, and investments in sustainable logistics practices. The market is expected to achieve steady growth through 2029, supported by increased demand for efficient supply chain solutions.
The market features several key players, including Toll Group, Linfox, DHL, and FedEx. These companies lead due to their extensive distribution networks, technological innovation, and ability to provide comprehensive logistics solutions. Emerging players such as Mainfreight and Aramex Australia are also gaining prominence.
Primary growth drivers include the rise of e-commerce, requiring robust last-mile delivery solutions, and government investment in infrastructure development, such as intermodal hubs. Additionally, the adoption of digital tools like AI, IoT, and blockchain is enhancing efficiency and transparency across the supply chain.
Challenges include infrastructure bottlenecks in remote areas, rising operational costs such as fuel and labor, and stringent environmental regulations requiring costly compliance measures. Additionally, small and medium-sized enterprises face difficulties in adopting advanced technologies due to high initial costs.
License Options
PDF + Excel
Complete report package
$4,000
Excel Only
Data and analytics
$2,500
Custom Sections
Starts from $100
$0