Australia Logistics and Warehousing Market Outlook to 2029
By Market Structure, By End-User Industry, By Mode of Transport, By Type of Warehousing, By Region
Report Overview
Report Code
TDR0172
Coverage
Asia
Published
May 2025
Pages
80
Flexible Purchase Options
Select and purchase only the chapters you need for your strategic decisions
On This Page
Report Overview
The report titled “Australia Logistics and Warehousing Market Outlook to 2029 - By Market Structure, By End-User Industry, By Mode of Transport, By Type of Warehousing, By Region.” provides a comprehensive analysis of the logistics and warehousing market in Australia. The report covers an overview and genesis of the industry, overall market size in terms of revenue, market segmentation; trends and developments, regulatory landscape, customer level profiling, issues and challenges, and comparative landscape including competition scenario, cross comparison, opportunities and bottlenecks, and company profiling of major players in the logistics and warehousing ecosystem.
Report Coverage
Verified Market Sizing
Multi-layer forecasting with historical data and 5–10 year outlook
Deep-Dive Segmentation
Cross-sectional analysis by product type, end user, application and region
Competitive Benchmarking & Positioning
Market share, operating model, pricing and competition matrices
Actionable Insights & Risk Assessment
High-growth white spaces, underserved segments, technology disruptions and demand inflection points
Review Methodology & Data Structure
Preview report structure, data sources and research framework
Executive Summary
The report titled “Australia Logistics and Warehousing Market Outlook to 2029 - By Market Structure, By End-User Industry, By Mode of Transport, By Type of Warehousing, By Region.” provides a comprehensive analysis of the logistics and warehousing market in Australia. The report covers an overview and genesis of the industry, overall market size in terms of revenue, market segmentation; trends and developments, regulatory landscape, customer level profiling, issues and challenges, and comparative landscape including competition scenario, cross comparison, opportunities and bottlenecks, and company profiling of major players in the logistics and warehousing ecosystem. The report concludes with future market projections based on industry revenue, by transport mode, end-user, and warehousing type, with cause and effect relationships, and success case studies highlighting major opportunities and caution areas.
Australia Logistics and Warehousing Market Overview and Size
The Australia logistics and warehousing market was valued at AUD 117 billion in 2024, driven by strong domestic and international trade, rapid e-commerce expansion, and the country's strategic location as a gateway to the Asia-Pacific. The industry is characterized by major players such as Toll Group, Linfox, DB Schenker, DHL Supply Chain, Australia Post, and Mainfreight, which offer integrated logistics and storage services across the country.
In 2023, Australia Post expanded its national fulfillment network by launching automated distribution hubs in Melbourne and Sydney to address rising last-mile delivery demand. Major urban centers such as Sydney, Melbourne, and Brisbane serve as key logistics hubs due to their high freight volumes, dense consumer bases, and access to multimodal transport networks.
Market Size for Australia Logistics and Warehousing Industry on the Basis of Revenue in USD Billion, 2018-2024

What Factors are Leading to the Growth of the Australia Logistics and Warehousing Market:
E-commerce Boom: With a 12% CAGR in e-commerce retail sales between 2019 and 2023, logistics providers have rapidly expanded their last-mile and fulfillment capabilities. By 2023, e-commerce logistics accounted for nearly 25% of total warehousing demand, particularly in urban and peri-urban regions.
Infrastructure Investments: Major investments in inland rail freight corridors, port modernization (e.g., Port of Melbourne upgrades), and airport logistics have created a robust backbone for domestic and international logistics. In 2023, government and private sector investments exceeded AUD 8 billion, aiming to increase supply chain resilience and capacity.
Third-Party Logistics (3PL) Demand: Small and medium enterprises (SMEs) and large multinationals increasingly outsource logistics functions to 3PL providers to reduce operational complexity. In 2023, 3PL services comprised over 60% of warehousing revenue, reflecting strong trust in end-to-end supply chain solutions.
Which Industry Challenges Have Impacted the Growth for Australia Logistics and Warehousing Market
Rising Operational Costs: The Australian logistics sector faces rising fuel, labor, and property lease costs, which directly affect profitability. In 2023, average warehousing rental costs increased by 9%, particularly in high-demand cities such as Sydney and Melbourne. Moreover, driver shortages and increasing wage expectations have placed added pressure on transport companies, reducing margins for smaller logistics operators.
Infrastructure Bottlenecks: Despite government investments, outdated infrastructure in certain regional corridors continues to impede supply chain efficiency. For instance, inefficiencies in intermodal connectivity and congestion at key ports such as the Port of Botany and Port of Melbourne led to average delivery delays of 2.5 days in 2023, impacting customer satisfaction and service reliability.
Skilled Labor Shortage: The sector is experiencing a growing gap in skilled labor, particularly in roles involving warehouse automation systems, supply chain analytics, and heavy-vehicle drivers. A 2023 survey revealed that 42% of logistics companies reported difficulties in recruiting and retaining qualified staff, which slowed down digital transformation and scalability efforts.
What are the Regulations and Initiatives which have Governed the Market
Heavy Vehicle National Law (HVNL): Administered by the National Heavy Vehicle Regulator (NHVR), this law governs vehicle safety, driver fatigue, load limits, and route access. In 2023, stricter enforcement of compliance led to a 15% increase in fines for overloading and non-compliant transport vehicles, prompting logistics firms to invest in advanced tracking and telematics solutions.
National Freight and Supply Chain Strategy: The Australian government’s long-term policy aims to streamline freight movement across state borders, encourage intermodal freight development, and reduce emissions. Under this framework, more than AUD 4 billion was allocated between 2020–2024 to develop freight rail lines and port expansions, boosting long-term logistics infrastructure capacity.
Warehousing Compliance and Zoning: Local councils and state authorities enforce stringent zoning regulations for warehousing facilities, especially in urban regions. Compliance includes fire safety, environmental impact assessments, and operational hours. In 2023, 26% of proposed new warehouse developments in major cities faced delays or rejections due to planning permission issues, pushing developers to consider regional hubs.
Australia Logistics and Warehousing Market Segmentation
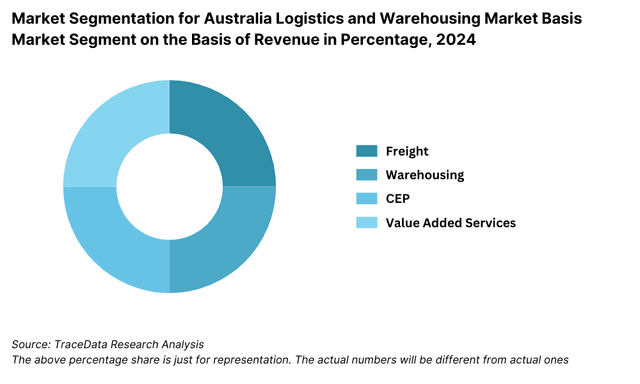
By Market Structure: The logistics market in Australia is largely dominated by organized players, especially in metro and tier-1 logistics corridors. These include integrated service providers like Toll Group, Linfox, and DHL, which offer end-to-end supply chain services across transport, warehousing, and last-mile delivery. Their extensive infrastructure, compliance capability, and digital tools give them a competitive edge. Unorganized players—mostly small fleet owners and independent warehouse operators—maintain stronghold in regional areas due to their local familiarity, lower cost base, and flexible operations. However, their share has been gradually declining due to the increasing complexity of logistics needs and digital integration across the supply chain.
By End-User Industry: The retail and e-commerce sector holds the largest share of the warehousing and logistics market, supported by high delivery volumes and rapid fulfillment requirements. In 2023, companies like Amazon, Woolworths, and Kmart contributed significantly to warehousing demand across key metro hubs. FMCG and Food Processing is another key vertical, especially in cold chain logistics, driven by rising consumer demand for perishable goods. Meanwhile, pharmaceuticals and healthcare saw accelerated growth post-pandemic, accounting for a larger share of specialized warehousing needs.
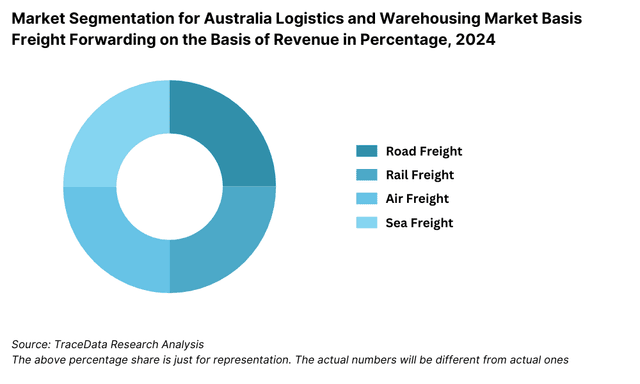
By Mode of Transport:Road transport dominates the logistics landscape in Australia due to its vast inland distribution network and flexibility. As of 2023, more than 65% of total freight volume was moved by road, with major corridors between Sydney–Melbourne and Melbourne–Brisbane being the busiest.
Rail freight is increasingly utilized for bulk goods and long-haul transport, particularly by mining and agriculture sectors. Air freight plays a niche role in high-value or time-sensitive deliveries, while sea freight remains crucial for international trade, especially through ports in Brisbane, Sydney, and Fremantle.
Competitive Landscape in Australia Logistics and Warehousing Market
The Australia logistics and warehousing market is moderately consolidated, with a mix of domestic and global players offering end-to-end supply chain services. Established providers such as Toll Group, Linfox, DB Schenker, DHL Supply Chain, Australia Post, Mainfreight, and Ceva Logistics dominate the landscape, especially in metro and high-demand corridors. The entry of e-commerce-driven fulfillment providers and tech-integrated 3PL startups is further reshaping the competitive dynamics, offering innovative, data-driven services and expanding reach across sectors.
| Company Name | Founding Year | Original Headquarters |
| Linfox | 1956 | Melbourne, Australia |
| Toll Group | 1888 | Melbourne, Australia |
| Qube Holdings | 2006 | Sydney, Australia |
| CTI Logistics | 1972 | Perth, Australia |
| ACFS Port Logistics | 2005 | Sydney, Australia |
| eStore Logistics | 2008 | Melbourne, Australia |
| Warehousing and Logistics Australia | 1998 | Perth, Australia |
| Express Freight Management | 1989 | Brisbane, Australia |
| MTS Warehousing & Distribution | 2000 | Brisbane, Australia |
| Packcentre Marketing Services | 1984 | Melbourne, Australia |
Some of the recent competitor trends and key developments include:
Toll Group: As one of Australia’s oldest logistics firms, Toll Group launched a new smart warehouse in Brisbane in 2023, featuring AI-based inventory systems and robotics for pick-and-pack. The facility added 60,000 sqm of warehouse space to its national footprint, enhancing capacity for FMCG and retail customers.
Linfox: Linfox expanded its cold chain logistics network across Queensland and Victoria in 2023, responding to rising demand in pharmaceuticals and food retail. The company also piloted electric truck deployments in metro freight operations, aligning with Australia's decarbonization targets.
DB Schenker: The company recorded double-digit growth in contract logistics revenue in Australia during 2023. It expanded warehousing capacity in Sydney’s Western Parklands to cater to electronics and consumer goods clients, emphasizing automation and green warehousing.
DHL Supply Chain: DHL opened a multi-client mega distribution center in Sydney in 2023, featuring solar power, smart sorting systems, and temperature-controlled zones. The facility supports e-commerce and healthcare clients and reflects DHL's focus on sustainability and innovation.
Australia Post: Leveraging the e-commerce surge, Australia Post invested in automated parcel sorting hubs in Sydney and Melbourne, enhancing last-mile delivery capabilities. In 2023, the logistics arm handled over 500 million parcels, supported by expanded fulfillment partnerships.
Mainfreight: Known for integrated freight and warehousing services, Mainfreight added new regional distribution centers in South Australia and Tasmania, improving service levels for manufacturing and retail clients.
Ceva Logistics: Ceva continued its growth in 3PL warehousing, focusing on contract logistics for the automotive and healthcare sectors. In 2023, the company implemented IoT-enabled warehouse management solutions across major sites to improve traceability and throughput.

What Lies Ahead for Australia Logistics and Warehousing Market?
The Australia logistics and warehousing market is projected to grow consistently through 2029, driven by e-commerce expansion, infrastructure modernization, and rising demand for flexible, tech-enabled supply chain solutions. The sector is expected to witness a CAGR of approximately 7–8% during the forecast period, with strong momentum across both transport and warehousing segments.
Acceleration in Automation and Smart Warehousing: The next phase of industry growth will be marked by widespread deployment of automation, robotics, and AI-powered warehouse management systems. By 2029, it is expected that over 50% of newly built warehouses will include smart automation features such as autonomous forklifts, robotic picking systems, and IoT-based inventory management.
Sustainable and Green Logistics: Environmental compliance and carbon footprint reduction will become central themes, especially in warehousing and last-mile delivery. More providers are anticipated to invest in green-certified buildings, renewable energy systems (solar, hydrogen), and EV fleets for urban distribution. The government's sustainability roadmap aims for net-zero transport sector emissions by 2050, with intermediate goals influencing procurement and asset development as early as 2027.
Regional and Tier-2 Expansion: As land costs and congestion rise in major cities, logistics developers will shift focus to tier-2 and regional zones such as Newcastle, Geelong, Toowoomba, and Townsville. These areas are already witnessing a 20% YoY increase in warehousing lease demand, supported by improved freight corridors and local industrial growth.
Rise of 3PL and Fulfillment-as-a-Service Models: The demand for third-party logistics (3PL) and fulfillment services is expected to grow substantially among SMEs and direct-to-consumer (D2C) brands. Providers offering plug-and-play logistics capabilities, real-time tracking, and flexible warehousing options will dominate this segment, which is expected to contribute over 65% of total warehousing revenues by 2029.
Future Outlook and Projections for Australia Logistics and Warehousing Market on the Basis of Revenues in USD Billion, 2024-2029


Australia Logistics and Warehousing Market Segmentation
By Market Structure:
Organized Sector
Unorganized Sector
3PL (Third-Party Logistics Providers)
Freight Forwarders
Contract Logistics Companies
Fulfillment-as-a-Service Providers
Postal & Parcel Service Providers
By End-User Industry:
E-commerce and Retail
FMCG
Food and Beverage
Pharmaceuticals and Healthcare
Automotive and Industrial Manufacturing
Agriculture and Cold Chain
Mining and Resources
Apparel and Consumer Electronics
By Mode of Transport:
Road Freight
Rail Freight
Sea Freight
Air Freight
Multimodal Logistics
By Type of Warehousing:
General Warehousing
Cold Storage / Temperature-Controlled Warehousing
Bonded Warehouses
Automated and Smart Warehousing
Distribution and Fulfillment Centers
Container Freight Stations (CFS)
Cross-Docking Facilities
By Region:
New South Wales
Victoria
Queensland
Western Australia
South Australia
Tasmania
Northern Territory
Australian Capital Territory (ACT)
Players Mentioned in the Report:
Freight Forwarding Companies
Think Global Logistics (TGL)
Freight Assist Australia
Freightplus
Freight Broker
Transcoast
CTI Logistics
MTF Logistics
Stockwells International
Orion Shipping
Cargoconnect
BR International Logistics
Australian Logistics Solutions
BCR Australia
Diamond Freight Services
UC Logistics Australia
Warehousing Companies
Nationwide Cold Storage & Distribution
G&S Logistics
Elite Logistics Australia
One Warehousing
Australian Logistics Solutions
E R Warehousing & Distribution Townsville
CS Logistic Solutions
Brisbane Logistics
Crawfords Freightlines
E-Commerce Logistics Companies
eStore Logistics
Shippit
Invenco
PikPak
CouriersPlease
Allied Express
Australia Post
UPS E-Commerce Logistics Services
Express Logistics Companies
Toll Global Express
Team Global Express
FedEx Australia
DHL Express
Aramex (Fastway)
StarTrack Express
Border Express
CouriersPlease
Allied Express
Key Target Audience:
Logistics Service Providers
Warehousing and Infrastructure Developers
E-commerce and Retail Companies
FMCG, Pharma, and Automotive Corporates
Cold Chain Solution Providers
Government Agencies and Infrastructure Authorities
Real Estate Investment Trusts (REITs)
Technology and Automation Vendors
Industry Associations (e.g., Australian Logistics Council, Supply Chain & Logistics Association of Australia)
Financial Institutions and Investors
Time Period:
Historical Period: 2018–2023
Base Year: 2024
Forecast Period: 2024–2029
Explore Flexible Purchase Options or Have Limited Budget?
Pay only for relevant chapters • Customizable report sections
Table of Contents
Choose individual sections to purchase. Mix and match as you like.
4.1 Macroeconomic Framework for Australia Including GDP (2018-2024), GDP Growth (2018-2024), GDP Contribution by Sector (Real vs Nominal GDP, Sectoral Split-Mining, Manufacturing, Services; Household Consumption, Gross Fixed Capital Formation, Net Exports)
4.2 Logistics Sector Contribution to GDP and How the Contribution Has Been Changing in the Historical Assessment
4.3 Ease of Doing Business in Australia
4.4 LPI Index of Australia and Improvements in the Last 10-15 Years
4.5 Custom Procedure and Custom Charges in Australia Logistics Market
5.1 Landscape of Investment Parks and Free Trade/Industrial Zones in Australia
5.2 Current Scenario for Logistics Infrastructure in Australia
5.3 Road Infrastructure in Australia Including Road Network, Toll Charges and Toll Network, Major Goods Traded Through Road, Major Flow Corridors for Road (Inbound and Outbound)
5.4 Air Infrastructure in Australia Including Total Volume Handled, FTK for Air Freight, Major Inbound and Outbound Flow Corridors, Major Goods Traded Through Air, Number of Commercial and Passenger Airports, Air Freight Volume by Ports and Other Parameters
5.5 Sea Infrastructure in Australia Including Total Volume Handled, FTK for Sea Freight, Major Inbound and Outbound Flow Corridors, Major Goods Traded Through Sea, Number of Ports for Coastal and Ocean Freight, Number of Vessels, Sea Freight Volume by Ports and Other Parameters
5.6 Rail Infrastructure in Australia Including Total Volume Handled, FTK for Rail Freight, Major Inbound and Outbound Flow Corridors, Major Goods Traded Through Rail and Others
6.1 Basis Revenues, 2018-2024P
7.1 By Segment (Freight Forwarding, Warehousing, CEP and Value-Added Services), 2018-2024P
7.2 By End User Industries, 2018-2024P
8.1 Market Overview and Genesis
8.2 Australia Freight Forwarding Market Size by Revenues, 2018-2024P
8.3 Australia 3PL Freight Forwarding Market Segmentation, 2018-2024P
8.3.1 By Mode of Freight Transport (Road, Sea, Air and Rail), 2018-2024P
8.3.1.1 Price per FTK for Road/Air/Sea and Rail in Australia
8.3.1.2 Road Freight (Domestic and International Volume, FTK and Revenue; Number of Registered Heavy Vehicles)
8.3.1.3 Road Freight Domestic Corridors
8.3.1.4 Ocean Freight (Domestic and International Volume, FTK and Revenue; Volume by Commodity; Sea Ports Key Statistics)
8.3.1.5 Air Freight (Domestic and International Volume, FTK and Revenue) (Main Routes, Overnight Networks, Express vs Standard Air)
8.3.1.6 Rail Freight (Domestic Volume, FTK and Revenue; Volume by Commodity and Region)
8.3.1.7 Export-Import Scenario (Value by Mode of Transport, Commodity and Country; Volume by Principal Commodities)
8.3.2 By Intercity Road Freight Corridors, 2018-2024P
8.3.3 By Interstate Line-Haul Road Freight Corridors, 2018-2024P
8.3.4 By End User (Industrial, FMCG, F&B, Retail and Others), 2018-2024P (Freight Composition, Service Requirements, Seasonality, Contractual Structures)
8.4 Snapshot of Freight Truck Aggregators in Australia Including Company Overview, USP, Business Strategies, Future Plans, Business Model, Number of Fleets, Margins/Commission, Number of Bookings, Major Clients, Average Booking Amount, Major Routes and Others
8.5 Competitive Landscape in Australia Freight Forwarding Market, 2024 (Market Structure, Concentration, Positioning of Global vs National Players)
8.5.1 Heat Map of Major Players in Australia Freight Forwarding on the Basis of Service Offering (Mode Coverage, Contract Logistics, Project Cargo, Cold Chain, Customs Brokerage)
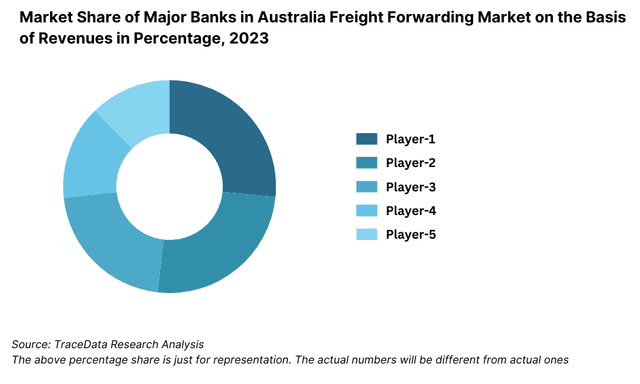
8.5.2 Market Share of Major Players in Australia Freight Forwarding Market, 2024 (Revenue-Based and Volume-Based Shares)
8.5.3 Cross Comparison of Major Players in Freight Forwarding Companies on the Basis of Parameters Including Volume of Road Freight, Inception Year, Number of Fleets (Owned and Subcontracted), Fleets by Type, Occupancy Rate, Number of Employees, Major Route Network, Major Clients, Revenues, Volume of Sea Freight, Volume of Air Freight, USP, Business Strategy, Technology, (2024)
8.6 Australia Freight Forwarding Future Market Size by Revenues, 2025-2029
8.7 Australia Freight Forwarding Market Segmentation, 2025-2029
8.7.1 Future Market Segmentation by Mode of Freight Transport (Road, Sea, Air and Rail), 2025-2029
8.7.2 Future Market Segmentation by Interstate Line-Haul Road Freight Corridors (East Coast, East-West and North-South), 2025-2029
8.7.3 Future Market Segmentation by End User (Industrial, FMCG, F&B, Retail and Others), 2025-2029
9.1 Market Overview and Genesis
9.2 Value Chain Analysis in Australia Warehousing Market Including Entities, Margins, Role of Each Entity, Process Flow, Challenges and Other Aspects
9.3 Australia Warehousing Market Size on the Basis of Revenues and Warehousing Space, 2018-2024P
9.4 Australia Warehousing Market Segmentation (Business Model, Warehouse Type, End-User Industry, Region)
9.4.1 Australia Warehousing Revenue by Business Model (Industrial/Retail, ICD/CFS and Cold Storage), 2018-2024P
9.4.2 Australia Warehousing By Type of Warehouse (General, Open Yard, Freezer/Chiller, Ambient and Bonded Warehouses), 2018-2024P
9.4.3 Australia Warehousing Revenue by End User (Industrial & Construction, FMCG, Retail, Food & Beverage and Others), 2018-2024P
9.4.4 3PL Warehousing Space by Region, 2024P
9.5 Competitive Landscape in Australia Warehousing Market (Top Developers, 3PL-Operated Sheds, Institutional Ownership, Build-to-Suit vs Speculative)
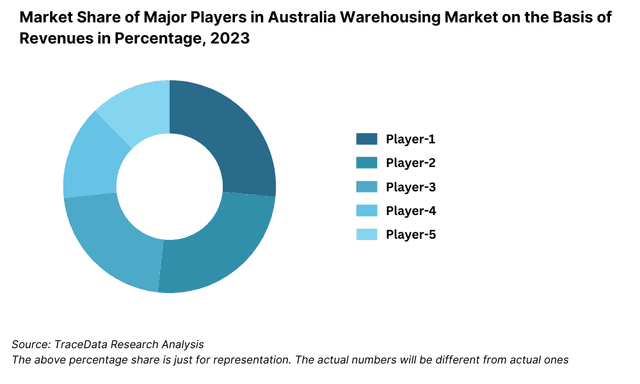
9.5.1 Market Share of Top 10 Companies in Australia Warehousing Market, 2024 (By Space and Warehousing Revenue)
9.5.2 Cross Comparison of Top 10 Warehousing Companies on the Basis of Parameters Including Company Overview, USP, Business Strategy, Future Plans, Technology, Revenues from Warehousing, Number of Warehouses, Warehousing Space, Location of Warehouses, Type of Warehouses, Occupancy Rate, Rental Rates, Clients and Others, (2024)
9.6 Australia Warehousing Future Market Size on the Basis of Revenues, 2025-2029
9.7 Australia Warehousing Market Future Segmentation (Future Business Model Mix, Warehouse Type Mix, End-User Mix, Regional Weight Shifts)
9.7.1 Australia Warehousing Revenue by Business Model (Industrial/Retail, ICD/CFS and Cold Storage), 2025-2029
9.7.2 Australia Warehousing Revenue By Type of Warehouse (General, Open Yard, Freezer/Chiller, Ambient and Bonded Warehouses), 2025-2029
9.7.3 Australia Warehousing Revenue by End User (Industrial & Construction, FMCG, Retail, Food & Beverage and Others), 2025-2029
10.1 Market Overview and Genesis
10.2 Value Chain Analysis in Australia CEP Market Including Entities, Margins, Role of Each Entity, Process Flow, Challenges and Other Aspects
10.3 Revenue Composition and Contribution Between First Mile/Mid Mile and Last Mile Delivery-Analysis for Domestic and International Shipments
10.4 Australia CEP Market Size on the Basis of Revenues and Shipments, 2018-2024P
10.5 Australia CEP Market Segmentation, 2024 (Product Type, Customer Type, Geography, Service Level)
10.5.1 Segmentation by Mails and Documents, E-Commerce Shipments and Express Cargo, 2023-2024P (Volume and Revenue Split)
10.5.2 Segmentation by International and Domestic Express, 2023-2024P (Outbound vs Inbound, Cross-Border E-commerce)
10.5.3 Segmentation by B2B, B2C and C2C, 2023-2024P (Customer Mix, Sectoral Contribution)
10.5.4 Segmentation by Period of Delivery, 2023-2024P (Same Day, Next Day, 2-3 Day, Economy)
10.6 Competitive Landscape in Australia CEP Market, 2024 (Postal Operator vs Integrators vs Local Couriers vs E-commerce Specialist 3PLs)
10.6.1 Overview and Genesis, Market Nature, Market Stage and Major Competing Parameters
10.6.2 Market Share of Companies in Australia CEP Market on the Basis of Revenues/Number of Shipments, 2024 (National Market Share Ranking)
10.6.3 Market Share of Top 5 Companies in Australia E-Commerce Shipment Market on the Basis of Revenues/Number of Shipments, 2024
10.6.4 Cross Comparison of Top 10 Australia CEP Companies on the Basis of Parameters Including Company Overview, USP, Business Strategy, Future Plans, Technology, Number of Last Mile Delivery Shipments, Revenues, Major Clients, Number of Fleets, Number of Employees, Number of Riders, Number of Postcodes Served, Major Service Offering and Others
10.7 Australia CEP Market Size on the Basis of Revenues and Shipments, 2025-2029
10.8 Australia CEP Market Segmentation (Future Mix by Product Category, Customer Type, Geography, Delivery Time)
10.8.1 Segmentation by Mails and Documents, E-Commerce Shipments and Express Cargo, 2025-2029
10.8.2 Segmentation by International and Domestic Express, 2025-2029
10.8.3 Segmentation by B2B, B2C and C2C, 2025-2029
10.8.4 Segmentation by Period of Delivery, 2025-2029
11.1 Customer Cohort Analysis and End User Paradigm for Different Industry Verticals under Logistics Sector (Telecommunications, FMCG, Automotive, Apparel, F&B, Construction and Pharmaceuticals)
11.2 Understanding on Logistics Spend by End User, 2023-2024P (Logistics Spend as % of Sales, Share of Transport vs Warehousing vs CEP)
11.3 End User Preferences in Terms of In-House or Outsourcing Logistics Services and Reason for Selection; Segregate This by Size of Company on the Basis of Revenues
11.4 Major Logistics Company Who Are Specialized in Serving Each Type of End User (Telecommunications, FMCG, Apparel, F&B, Construction and Pharmaceuticals)
11.5 Detailed Landscape of Each End Users Across Parameters Including Major Products Manufactured and Traded, Emerging Products, Type of Services Required, and Type of Services Outsourced, Major Companies, Contract Duration, Likelihood to Recommend, Market Orientation, Major Clusters, Type of Sourcing Preference, Pain Points, Facilities/Services Required, Future Outlook. Market Size for End User Industry Vertical with Growth Rate, 2018-2024P
12.1 Basis Revenues, 2025-2029
13.1 By Segment (Freight Forwarding, Warehousing, CEP and Value-Added Services), 2025-2029
13.2 By End User Industries, 2025-2029 (Future Sectoral Contribution, Emerging Verticals-Renewable Energy, High-Tech, Healthcare)
13.3 Recommendation
13.4 Opportunity Analysis
Discuss a Customized Research Scope
Custom research scope • Tailored insights • Industry expertise
Research Methodology
Step 1: Ecosystem Creation
Map the ecosystem and identify all the demand side and supply side entities for Australia Logistics and Warehousing Market. Basis this ecosystem, we will shortlist leading 5-6 players in the country based upon their financial information, operational scale, warehousing footprint, and service coverage.
Sourcing is made through industry articles, multiple secondary, and proprietary databases to perform desk research around the market to collate industry-level information.
Step 2: Desk Research
Subsequently, we engage in an exhaustive desk research process by referencing diverse secondary and proprietary databases. This approach enables us to conduct a thorough analysis of the market, aggregating industry-level insights. We delve into aspects like the market revenues, number of logistics and warehousing players, freight volume, space absorption trends, and pricing. We supplement this with detailed examinations of company-level data, relying on sources like press releases, annual reports, financial statements, and similar documents. This process aims to construct a foundational understanding of both the market and the entities operating within it.
Step 3: Primary Research
We initiate a series of in-depth interviews with C-level executives and other stakeholders representing various Australia Logistics and Warehousing Market companies and end-users. This interview process serves a multi-faceted purpose: to validate market hypotheses, authenticate statistical data, and extract valuable operational and financial insights from these industry representatives. Bottom to top approach is undertaken to evaluate freight handled, warehousing capacity, and leasing revenue for each player thereby aggregating to the overall market.
As part of our validation strategy, our team executes disguised interviews wherein we approach each company under the guise of potential customers. This approach enables us to validate the operational and financial information shared by company executives, corroborating this data against what is available in secondary databases. These interactions also provide us with a comprehensive understanding of revenue streams, value chain, warehousing pricing, and other logistics-specific operational factors.
Step 4: Sanity Check
- Bottom to top and top to bottom analysis along with market size modeling exercises is undertaken to assess sanity check process.
See What's Inside the Report
Get a preview of key findings, methodology and report coverage
Frequently Asked Questions
The Australia logistics and warehousing market is set for robust expansion, reaching a valuation of AUD 117 Billion in 2023. This growth is driven by rising e-commerce penetration, increased demand for supply chain resilience, infrastructure investments, and digital transformation across the logistics sector. The market’s potential is further enhanced by Australia's strategic geographic position in the Asia-Pacific, acting as a critical hub for regional trade and distribution.
The Australia Logistics and Warehousing Market features several key players including Toll Group, Linfox, DB Schenker, and DHL Supply Chain. These companies dominate the market with their expansive infrastructure, integrated logistics services, and established client bases. Other major players include Australia Post, Mainfreight, and Ceva Logistics.
Key growth drivers include the rapid rise of e-commerce and omnichannel retailing, infrastructure upgrades such as inland freight corridors and automated distribution hubs, and growing adoption of third-party logistics (3PL) services. Additionally, increased demand for cold chain logistics, sustainability-led innovations, and government initiatives in freight strategy are contributing to the market’s upward trajectory.
The market faces several challenges including rising operational costs—particularly related to labor and fuel—urban land scarcity for warehouse development, and regional infrastructure bottlenecks. Furthermore, the industry struggles with skilled labor shortages and the high capital expenditure required for automation and sustainability compliance, which can hinder growth for smaller logistics players.
License Options
PDF + Excel
Complete report package
$4,000
Excel Only
Data and analytics
$2,500
Custom Sections
Starts from $100
$0