Australia Pre-Engineered Metal Building (PEB) Market Outlook to 2030
By End Use, By Structural Frame Type, By Building Envelope System, By Delivery Model, By Design Environment (Wind Regions & Corrosion Categories), and By Region
Report Overview
Report Code
TDR0226
Coverage
Asia
Published
August 2025
Pages
80
Flexible Purchase Options
Select and purchase only the chapters you need for your strategic decisions
On This Page
Report Overview
The report titled “Australia Pre-Engineered Metal Building (PEB) Market Outlook to 2030 — By End Use, By Structural Frame Type, By Building Envelope System, By Delivery Model, By Design Environment (Wind Regions & Corrosion Categories), and By Region” provides a comprehensive analysis of Australia’s PEB industry. The report covers an overview and genesis of the sector, overall market size in terms of AUD revenue, fabricated steel tonnage, and built-up gross floor area (m²); detailed market segmentation; trends and developments, regulatory landscape, customer-level profiling, issues and challenges, and the competitive landscape, including competition scenario, cross-comparison benchmarking, opportunity pockets and bottlenecks, and...
Report Coverage
Verified Market Sizing
Multi-layer forecasting with historical data and 5–10 year outlook
Deep-Dive Segmentation
Cross-sectional analysis by product type, end user, application and region
Competitive Benchmarking & Positioning
Market share, operating model, pricing and competition matrices
Actionable Insights & Risk Assessment
High-growth white spaces, underserved segments, technology disruptions and demand inflection points
Review Methodology & Data Structure
Preview report structure, data sources and research framework
Executive Summary
The report titled “Australia Pre-Engineered Metal Building (PEB) Market Outlook to 2030 — By End Use, By Structural Frame Type, By Building Envelope System, By Delivery Model, By Design Environment (Wind Regions & Corrosion Categories), and By Region” provides a comprehensive analysis of Australia’s PEB industry. The report covers an overview and genesis of the sector, overall market size in terms of AUD revenue, fabricated steel tonnage, and built-up gross floor area (m²); detailed market segmentation; trends and developments, regulatory landscape, customer-level profiling, issues and challenges, and the competitive landscape, including competition scenario, cross-comparison benchmarking, opportunity pockets and bottlenecks, and company profiling of major players. The report concludes with future market projections based on project counts, m² GFA additions and steel tonnage across end uses and regions, scenario analysis by delivery model and design environment, cause-and-effect relationships between demand drivers and capacity, and success case studies highlighting cyclone-compliant logistics assets, modular cold-stores, and remote resources facilities—pinpointing the major opportunities and cautions for stakeholders.
Australia Pre-Engineered Metal Building Market Overview and Size
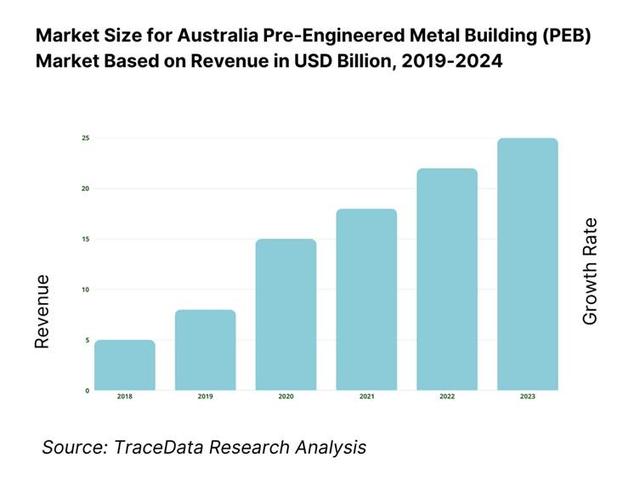
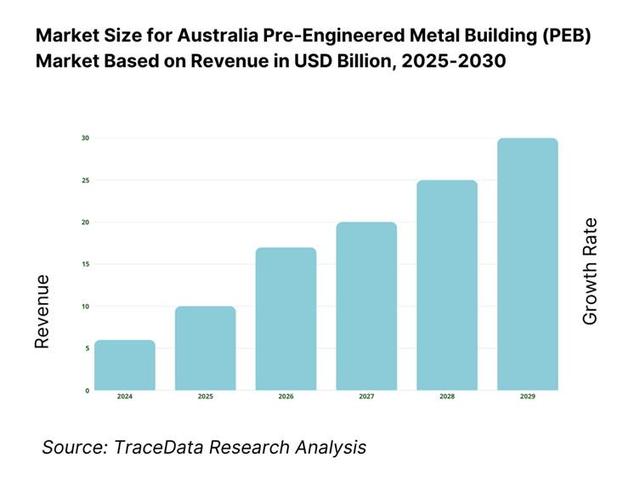
The Australia pre‑engineered metal building market is valued at USD 342 million as of 2024. This figure reflects a five‑year trajectory culminating in that valuation, with historical data captured over the prior period. The market growth has been driven by accelerated demand for infrastructure and industrial developments, government incentives for modular construction, and surging logistics and warehousing requirements linked to booming e‑commerce volumes.
Australia’s PEB activity is concentrated in key urban and regional hubs such as Sydney, Melbourne, and Brisbane, where large industrial corridors, ports, and logistics facilities demand rapid, scalable building solutions. Additionally, Darwin and Cairns exhibit strong adoption due to cyclone‑resistant needs driven by local wind‑region regulations and infrastructure demands in tropical zones. These locations dominate due to their infrastructure scale, regulatory pressures, and concentrated industrial growth.
What Factors are Leading to the Growth of the Australia Pre-Engineered Metal Building Market:
Warehouse Absorption: The surge in warehousing demand is enhancing PEB adoption: Australia’s public infrastructure pipeline includes 8.1 million tonnes of steel over five years (2023–2027), with structural steel making up a substantial portion—3.8 million tonnes of girders and 3.6 million tonnes of reinforcement—indicative of major warehouse and industrial builds. This aligns with the construction uplift in buildings infrastructure, valued at AUD 71 billion in the same period, of which health and residential sectors are key drivers of steel-intensive builds. These figures underscore the material demand underpinning large-scale, pre‑engineered steel structures.
Intermodal & Cold-Chain Expansion: Australia’s resources and energy sector remains buoyant with mineral exports at AUD 415 billion for 2023/24, spanning iron ore, LNG, coal, gold, and copper. Such high-volume exports necessitate expanded cold‑chain and intermodal infrastructure—often delivered via PEBs—for logistics and bulk storage. The export value of iron ore alone was AUD 141 billion, while LNG contributed AUD 70 billion, evidencing the underlying freight and storage expansion in intermodal facilities that rely on fast‑to‑deploy steel structures.
Resources Projects: Australia had 455 major resources and energy projects under development as of October 2024, including 68 committed and 66 at advanced feasibility stages. These involve AUD 3 billion in infrastructure—including port, rail, and processing facilities—feeding into demand for large-scale PEB-based structures. Further, critical minerals projects maintain a pipeline of AUD 20 billion in later-stage investment, a quarter of which are critical minerals developments, all of which typically require modular, steel-based facilities due to remote locations and rapid timeline constraints.
Which Industry Challenges Have Impacted the Growth of the Australia Pre-Engineered Metal Building Market:
Steel Price Volatility: The demand for steel materials in construction is clear—over the five-year outlook, 8.1 million tonnes of steel are anticipated in public infrastructure projects, yet steel input costs remain sensitive to global price shifts. While exact pricing isn't disclosed, the magnitude of volume reliance on steel girders (0.6 million tonnes) highlights exposure to market fluctuations, which can sharply impact profit margins for PEB fabricators reliant on long-lead structural inputs.
Skilled Labour Availability: Infrastructure Australia reports a 20% decline in full-time equivalent labour demand across the infrastructure pipeline in 2023–24 versus prior projections—evidencing that wage and labour constraints are reshaping project delivery and highlighting shortages of skilled erectors and fabricators needed for PEB deployment. This reduced labour pull reflects market struggles to maintain workforce capacity—especially in regional and remote areas critical for construction volume.
Transport Permits & Oversize Logistics: Freight transport infrastructure underpins regional connectivity. The Roads of Strategic Importance initiative allocates AUD 5.8 billion, including AUD 1.5 billion targeted at Northern Australia, to upgrade road connections linking mining and agriculture zones to ports. Oversize PEB modules require specialized handling, and although enabling roads are being upgraded, the scale of regulatory permitting and limited route capacity in regions remains a logistical bottleneck—not alleviated solely by infrastructure funding.
What are the Regulations and Initiatives which have Governed the Market:
Structural Compliance & Safety Standards (NCC + AS/NZS 5131/NSSCS): PEB design and fabrication in Australia are governed by the National Construction Code (NCC) classifications—particularly Class 7b warehouses, Class 7a carparks, Class 8 processing buildings, and Class 9b assembly—and structural actions in AS/NZS 1170.2 (wind). Industry adoption of the National Structural Steelwork Compliance Scheme (NSSCS), audited by Steelwork Compliance Australia, has scaled materially, with 155 fabricators certified to AS/NZS 5131 construction categories (latest year). This lifts traceability across welding, materials and erection QA—critical for cyclone/wind-region projects and large-span portal frames common in PEBs.
Sustainability Ratings & Responsible Products (NABERS + Green Star): Policy and procurement are increasingly linking industrial builds to verified sustainability tools. In FY24, NABERS certified 5,000 ratings and launched the Embodied Carbon pilot backed by AUD 4.8 million from the NSW Government, with explicit alignment to future NCC revisions and government procurement frameworks—pushing demand for steel with EPDs and verifiable embodied-carbon data. In parallel, Green Star issued 1,084 certifications in FY 2023/24 and reports 5,665 certifications all-time, while its Responsible Products program rewards specifying products with recognised initiatives (e.g., EPDs/ResponsibleSteel) across structure and envelope—directly affecting PEB steel and panel selection.
Oversize/Overmass (OSOM) Movement & Access Permits (NHVR): PEB delivery relies on heavy modules and long members that trigger OSOM rules. The National Heavy Vehicle Regulator reported 172,000+ road access permits issued in 2023–24, 3,928 new Performance-Based Standards combinations added, and 4,299 PBS vehicle approvals—easing access for longer/heavier configurations used to move portal frames, trusses and panels. Roadworthiness enforcement also intensified: the 2024 National Roadworthiness Survey inspected 9,082 vehicles and combinations, and NHVR escorted a 477-tonne superload across VIC-NSW—illustrating the compliance environment PEB logistics must plan for (routes, pilots, curfews).
Australia Pre-Engineered Metal Building Market Segmentation
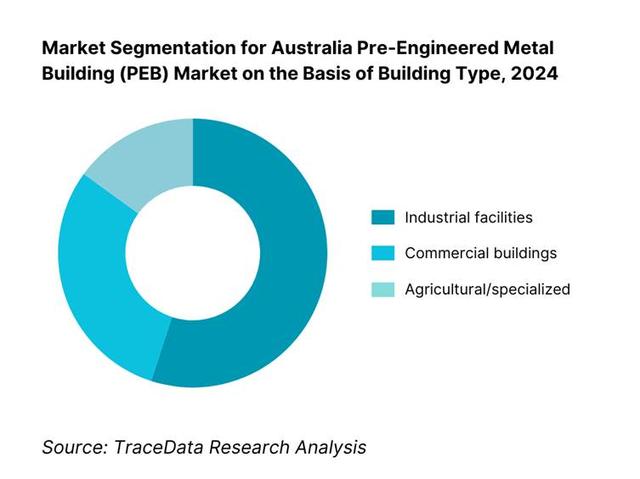
By Building Type: Australia PEB market divides by building type into Industrial/Central-Hub Facilities, Commercial Structures, and Agricultural/Specialized Facilities. Industrial facilities dominate due to ongoing expansions of warehouses, logistics centres, and processing plants, which require fast-to-market, large-clear-span structures and favour pre-engineered solutions for speed and cost-effectiveness.
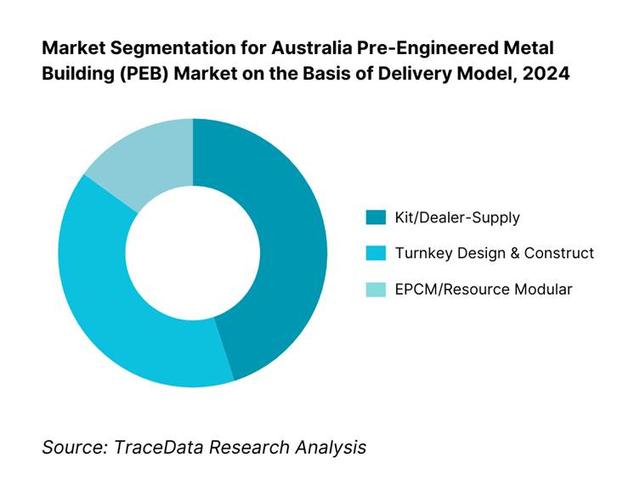
By Delivery Model: The market splits by delivery model into Kit/Dealer-Supply, Turnkey D&C, and EPCM/Resource Modular Solutions. Kit/Dealer-Supply leads due to its cost advantages, faster lead times, and wide availability from established roll-forming dealers across Australia, especially for mid-sized industrial buildings where buyers favour off-the-shelf solutions with high customization yet reduced project complexity.
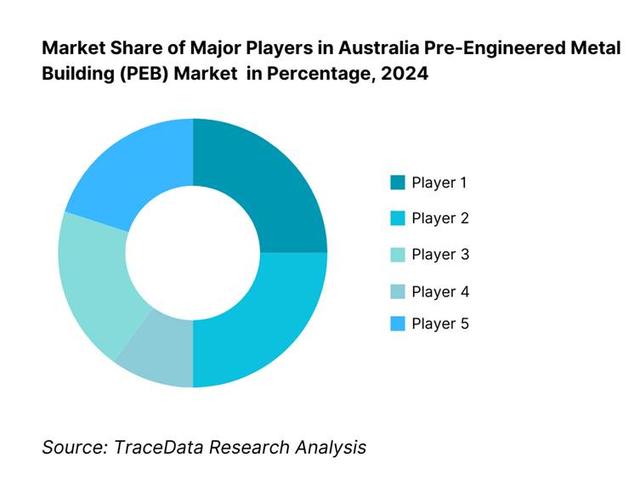
Competitive Landscape in Australia Pre-Engineered Metal Building Market
Australia’s PEB market features a relatively consolidated competitive landscape, driven by several prominent domestic and global players, including BlueScope Lysaght, Stramit, Metroll, Fielders, Kingspan, and Bondor. These companies maintain influence through integrated supply chains, dealer networks, compliance credentials (SCA/ShedSafe), and tailored solutions for wind/cyclone regions.
Name | Founding Year | Headquarters |
BlueScope Lysaght (Ranbuild) | 1960s | Melbourne, Australia |
Stramit (Fair Dinkum Builds) | 1980s | Brisbane, Australia |
Metroll Group | 1970s | Sydney, Australia |
Fielders (BlueScope) | 1970s | Adelaide, Australia |
Ahrens Group | 1906 | Kingsford, Australia |
Kingspan Insulated Panels | 1965 | Canberra, Australia |
Bondor Metecno | 1950s | Brisbane, Australia |
Steeline | 1990s | Newcastle, Australia |
The Shed Company | 1990s | Queensland, Australia |
Wide Span Sheds | 2000s | Gold Coast, Australia |
Some of the Recent Competitor Trends and Key Information About Competitors Include:
BlueScope Lysaght (Ranbuild): As one of the largest PEB solution providers in Australia, BlueScope Lysaght expanded its Ranbuild dealer network in 2024, focusing on cyclone-resistant shed and warehouse solutions in Queensland and Northern Territory. The company also emphasized sustainability by promoting COLORBOND® steel with Environmental Product Declarations (EPDs) to meet Green Star requirements.
Stramit (Fair Dinkum Builds): Stramit has enhanced its digital design tools for Fair Dinkum Builds, enabling customers and dealers to configure compliant sheds and industrial structures online. In 2024, Stramit recorded increased uptake in regional logistics projects, driven by e-commerce warehousing demand.
Metroll Group: Metroll invested in expanding its roll-forming capacity across New South Wales and Victoria in 2024, responding to strong demand from mid-sized industrial builders. The company also introduced corrosion-resistant coated steel options to serve coastal and tropical projects.
Ahrens Group: Ahrens, with its vertically integrated fabrication and construction model, reported growth in turnkey logistics and agricultural projects in 2024. The firm focused on large-span PEB solutions for grain storage, equine arenas, and defence facilities, strengthening its role as a full-service provider.
Kingspan Insulated Panels: Kingspan Australia expanded its high-performance insulated panel range in 2024, targeting cold-chain logistics and food processing sectors. The company highlighted energy efficiency and embodied carbon reduction, aligning its offerings with NABERS and Green Star sustainability frameworks.
What Lies Ahead for the Australia Pre-Engineered Metal Building (PEB) Market?
The Australia PEB market is set for steady expansion through the rest of the decade, propelled by rapid warehousing build-outs for e-commerce and cold-chain, a durable resources project pipeline, defence and aviation hangar needs, and government-backed infrastructure activity. Tight construction labour and the push to shorten time-to-revenue are tilting developers toward offsite steel solutions that deliver clear spans, predictable schedules, and assured compliance in cyclone and coastal zones. Sustainability mandates (embodied-carbon disclosure, Green Star/NABERS pathways) further favour prefabricated steel systems backed by product EPDs and warranty programs.
Rise of Hybrid Delivery Models: Australia’s next wave of PEB adoption will blend kit/dealer supply for speed and value on standard footprints with turnkey D&C and EPCM for complex logistics, mining, defence and aviation assets. Expect deeper DfMA/modular integration—factory-built frames, pre-cut secondary members, and panelised envelopes—so sites become assembly hubs rather than fabrication yards. Hybrid models also de-risk remote projects: oversized portal frames are rationalised into transportable modules, then stitch-connected on arrival. Contractors will increasingly pair local erection crews with national roll-forming and insulated-panel networks to balance lead times, freight costs, and cyclone-region compliance.
Focus on Outcome-Based Performance: Procurement is shifting from inputs to assured outcomes: schedule certainty (weeks-to-lock-up), NCC performance solutions for Class 7a/7b/8/9b assets, and verified building physics (airtightness, condensation control, thermal resistance). Owners are specifying clear-span thresholds, crane-runway capacities, corrosion categories and coastal warranties as measurable deliverables—backed by QA packs (as-built models, weld/bolt traceability to AS/NZS standards). Outcome-based contracting codifies wind-region design actions, door/opening pressures, serviceability limits, and defect liability tied to envelope integrity, lowering lifecycle risk for logistics, cold-store, and high-duty industrial facilities.
Expansion of Sector-Specific Systemisation: PEB suppliers are productising sector packs: logistics (mezzanine-ready grids, high door pressures), cold-chain (PIR/MW insulated panels, thermal breaks, vapour control), resources/MRO (wide bays, heavy crane loads, dust/ventilation), aviation & defence (large-opening/hangar doors, progressive collapse checks), agri & equine (corrosion class coatings, long eaves). Systemised details shorten approvals, compress design cycles, and standardise warranty pathways. Expect stronger alliances with REITs and national 3PLs to roll out repeatable warehouse typologies, and with EPC/EPCM teams for remote workshops and process buildings that demand rapid mobilisation and predictable site durations.
Leveraging AI and Analytics: Digital engineering becomes the backbone: BIM-native configurators automate portals, purlin/girt layouts and connection families; parametric wind load engines speed AS/NZS 1170.2 checks; and steel take-off optimisers trim kg/m² without compromising stiffness or drift limits. Cloud model coordination (IFC/Revit/Tekla) reduces clashes with services and conveyors; digital twins track envelope performance, warranty conditions, and planned maintenance. Expect AI-assisted value-engineering that proposes envelope swaps (built-up vs insulated panels), foundation options, and erection sequences, all benchmarked against embodied-carbon and programme metrics to improve ROI across portfolios.
Australia PEB Market Segmentation
By Building Type
Industrial & Logistics Facilities
Manufacturing & Processing Plants
Agriculture & Rural Structures
Aviation & Defence Hangars
Community & Commercial Structures
By Structural Frame/Design
Single-Span Clear-Span
Multi-Gable Frame
Crane-Bearing Structures
Mezzanine/Office Integrated
Large-Opening Hangars & Arenas
By Building Envelope System
Single-Skin Metal Sheeting
Built-Up Metal Systems
Insulated Sandwich Panels
Hybrid Systems
Specialty Coated Systems
By Delivery Model
Kit/Dealer-Supply Network
Turnkey Design & Construct (D&C)
EPCM/Resource-Sector Projects
General Contractor-Led Subcontracting
Modular/DfMA Integrated Delivery
By Region
New South Wales / ACT
Victoria / Tasmania
Queensland
South Australia / Northern Territory
Western Australia
Players Mentioned in the Report:
BlueScope Lysaght (Ranbuild)
Stramit (Fair Dinkum Builds)
Metroll Group
Fielders (BlueScope)
Ahrens Group
Kingspan Insulated Panels
Bondor Metecno
Steeline
The Shed Company
Sheds n Homes
Wide Span Sheds
ABC Sheds
Steel Buildings Australia
Totalspan Australia
Fair Dinkum Builds
Key Target Audience
Infrastructure & property developers
Logistics & warehousing operators
Mining & resources infrastructure teams
Defence & aviation facility planners
State and federal government construction agencies (e.g., Department of Infrastructure, ABLC/Infrastructure Australia)
Renewable energy project developers
Investments & venture capitalist firms (specializing in industrial/modular construction)
Government and regulatory bodies
Time Period:
Historical Period: 2019-2024
Base Year: 2025
- Forecast Period: 2025-2030
Explore Flexible Purchase Options or Have Limited Budget?
Pay only for relevant chapters • Customizable report sections
Table of Contents
Choose individual sections to purchase. Mix and match as you like.
4.1 Delivery Model Analysis for PEB Projects (Dealer-Kit Supply, Turnkey D&C, EPCM/Resource Projects, Modular/DfMA)
4.2 Revenue Streams for PEB Industry (Fabrication Revenue, Panel/Envelope Sales, Turnkey Contracting, Service & Maintenance, Warranty & Upgrades)
4.3 Business Model Canvas for PEB Market (Key Activities, Partners, Channels, Cost Structure, Value Proposition, Revenue Streams)
5.1 Independent Fabricators vs Integrated PEB System Players
5.2 Investment Models (Steelmakers Forward Integration, Franchise/Dealer Expansion, EPC Alliances)
5.3 Comparative Analysis of Procurement/Funnelling Processes (Private REIT Warehousing vs Public Infrastructure/Defence Projects)
5.4 PEB Budget Allocation by Company Size (Large Developers, Mid-tier Builders, SMEs)
8.1 Revenues & Tonnage (2019-“2024)
9.1 By Market Structure (In-House vs Outsourced Fabrication & Erection)
9.2 By Building Type (Single-Span, Multi-Gable, Crane-Bearing, Mezzanine Integrated, Hangars)
9.3 By Industry Verticals (Logistics & Warehousing, Manufacturing, Mining & Resources, Agriculture, Aviation & Defence, Community/Sport)
9.3.1 By Type of Logistics/Warehousing Facility (Cold-Chain, Intermodal, BTS, Speculative)
9.3.2 By Type of Mining/Resources Facility (Workshops, Processing Plants, MRO Sheds)
9.3.3 By Type of Agricultural Facility (Arenas, Feedlots, Storage, Equine)
9.3.4 By Type of Aviation Facility (Maintenance Hangars, Cargo, Defence)
9.4 By Company Size (Large Developers/REITs, Mid-tier Contractors, SMEs)
9.5 By Project Scale (<1,000 m², 1,000-“10,000 m², >10,000 m²)
9.6 By Mode of Delivery (Kit Supply, D&C Turnkey, EPCM Resources, Modular)
9.7 By Standard vs Custom Design (Catalogue/Kit vs Engineered-to-Order)
9.8 By Region (NSW/ACT, VIC/TAS, QLD incl. Cyclone Zones, SA/NT, WA)
10.1 Developer & REIT Client Landscape and Cohort Analysis
10.2 PEB Adoption Drivers in Decision-Making (speed, cost, span flexibility, cyclone compliance)
10.3 Project Effectiveness & ROI (life-cycle cost vs tilt-up concrete, energy/maintenance savings)
10.4 Gap Analysis Framework (specification mismatches, delivery risks, labour shortages)
11.1 Trends and Developments (BIM workflows, modularisation, hybrid steel-panel systems, green ratings)
11.2 Growth Drivers (logistics expansion, mining capex, e-commerce, defence spend, regional hubs)
11.3 SWOT Analysis
11.4 Issues and Challenges (steel volatility, skilled labour, compliance costs, logistics constraints)
11.5 Government Regulations (NCC pathways, AS 4100/4600, AS/NZS 1170.2 wind, SCA/ShedSafe accreditation, Green Star/NABERS embodied carbon)
12.1 Market Size & Future Potential for Digital/Modular PEB Design & Delivery (2019-“2030)
12.2 Business Models and Revenue Streams (Dealer Portals, BIM-as-a-Service, Prefabricated Kits)
12.3 Delivery Models and Types of Structures Offered (Pre-engineered Kits, Modular Cold-Chain, Custom Large-Span)
12.4 Cross Comparison of Leading Digital/Dealer PEB Companies (Company Overview, Investment, Revenues, Dealer Networks, Product Range, Pricing, Digital Tools, Clients)
15.1 Market Share of Key Players (AUD revenues, fabrication tonnage, dealer network size)
15.2 Benchmark of 15 Key Competitors (Company Overview, USP, Strategies, Business Model, No. of Fabrication Plants, Revenues, Pricing, Technology Used, Major Projects, Tie-ups, Marketing, Recent Developments)
15.3 Operating Model Analysis Framework
15.4 Gartner Magic Quadrant (PEB players vs capability & vision)
15.5 Bowmans Strategic Clock (Pricing & Differentiation Strategies)
16.1 Revenues & Tonnage (2025-“2030)
17.1 By Market Structure (In-House and Outsourced Fabrication/Erection)
17.2 By Building Type (Single-Span, Multi-Gable, Crane-Bearing, Mezzanine, Hangars)
17.3 By Industry Verticals (Logistics, Manufacturing, Mining, Agriculture, Aviation, Community)
17.3.1 By Type of Logistics Facility
17.3.2 By Type of Mining Facility
17.3.3 By Type of Agricultural Facility
17.3.4 By Type of Aviation Facility
17.4 By Company Size (Large Developers, Mid-tier, SMEs)
17.5 By Project Scale (<1,000 m², 1,000-“10,000 m², >10,000 m²)
17.6 By Mode of Delivery (Kit, Turnkey, EPCM, Modular)
17.7 By Standard vs Custom Designs
17.8 By Region (NSW/ACT, VIC/TAS, QLD incl. Cyclone Zones, SA/NT, WA)
Discuss a Customized Research Scope
Custom research scope • Tailored insights • Industry expertise
Research Methodology
Step 1: Ecosystem Creation
We begin by mapping the complete ecosystem of the Australia PEB market, encompassing both demand-side entities (developers, logistics REITs, mining operators, agricultural cooperatives, aviation and defence agencies) and supply-side participants (steelmakers, roll-formers, PEB system integrators, fabricators, erectors, dealer networks, panel manufacturers, certifiers, and government regulators such as the Australian Building Codes Board). Based on this ecosystem, we shortlist 5–6 leading providers in the country—including BlueScope Lysaght, Stramit, Metroll, Ahrens Group, Kingspan, and Bondor Metecno—using parameters such as fabrication capacity, dealer networks, regional presence, and compliance credentials. Sourcing is conducted using Infrastructure Australia reports, ABS data, company filings, and government construction pipelines to collate industry-level insights.
Step 2: Desk Research
An exhaustive desk research process is carried out by referencing a wide array of secondary and proprietary databases. This allows us to build a comprehensive baseline of the Australia PEB market, aggregating insights on structural steel demand, construction pipeline volumes, number of fabricators, delivery models, and compliance requirements. In addition, company-level data is examined through press releases, sustainability reports, annual financial statements, and SCA/ShedSafe accreditation disclosures. This step constructs a foundational understanding of both the macroeconomic drivers (infrastructure investment, resources exports, industrial property development) and the micro-level company practices (supply chains, warranty programs, regional dealer coverage).
Step 3: Primary Research
We conduct in-depth interviews with C-level executives, fabrication plant managers, project directors, and compliance officers from leading PEB companies and end-user industries. These interviews serve multiple purposes: validating market hypotheses, authenticating statistical insights, and extracting operational data on fabrication throughput, project cycle times, regional demand bottlenecks, and product innovations. A bottom-to-top approach is employed to map fabrication tonnage and project revenue contributions per player, which is then aggregated to estimate the overall market. To strengthen validation, our team also executes disguised interviews—approaching select companies as potential clients—allowing us to cross-check operational details, pricing logic, and project financing models against secondary sources. These interactions also provide visibility on supply chain risks, erection productivity, corrosion-category warranty structures, and sustainability initiatives.
Step 4: Sanity Check
Finally, a combined bottom-to-top and top-to-bottom analysis is performed to ensure the robustness of our results. This includes aligning market size modelling against official infrastructure spending data from Infrastructure Australia, ABS steel usage volumes, and the Department of Industry’s resource project pipelines. The dual approach validates the integrity of our numbers, ensuring that estimates for fabrication output, regional demand clusters, and company-level market shares are both consistent and cross-verified. The result is a comprehensive, accurate, and validated representation of the Australia PEB market.
See What's Inside the Report
Get a preview of key findings, methodology and report coverage
Frequently Asked Questions
Australia’s PEB potential is underpinned by a large and visible steel-intensive build pipeline. Infrastructure Australia estimates 3.8 million tonnes of fabricated steel structure elements are needed over 2023–24 to 2027–28, with buildings accounting for 55% of that demand—prime territory for portal-frame and panelised steel systems. Domestic fabrication mapped across 296 fabricators shows about 939,500 t/year capacity, with ~69% located in NSW, QLD and VIC—supporting scalable, rapid PEB delivery for warehouses, cold-chain, resources MRO and regional industrial assets.
Leading suppliers and brands span integrated steelmakers, roll-formers, insulated-panel makers and national shed/PEB networks: BlueScope Lysaght (Ranbuild), Stramit (Fair Dinkum Builds), Metroll, Fielders, Ahrens Group, Kingspan Insulated Panels, Bondor Metecno, Steeline, The Shed Company, Sheds n Homes, Wide Span Sheds, ABC Sheds, Steel Buildings Australia, Totalspan, and Ranbuild Commercial. (Representative sources confirming market presence/offerings: Ranbuild/LYSAGHT; Stramit/Fair Dinkum; Metroll; Fielders; Ahrens; Kingspan; Bondor; Steeline; The Shed Company; Sheds n Homes; Wide Span Sheds; ABC Sheds; Steel Buildings Australia; Totalspan.)
Three macro engines support continued PEB uptake. (1) A steel-heavy project pipeline: Infrastructure Australia’s outlook calls for 3.8 Mt fabricated steel needs through 2027–28, with buildings leading; it also notes $20 billion committed for Rewiring the Nation transmission—spurring logistics, depots and industrial support facilities that favour fast PEB assembly. (2) Non-residential build momentum: ABS reports the value of non-residential approvals at $7.23 billion in June (seasonally adjusted), reinforcing demand for industrial/warehouse envelopes. (3) Investment tailwinds from mining: ABS “Estimate 6” guides $54.7 billion planned mining capex for 2024–25, creating sustained demand for workshops, warehouses and remote facilities typically delivered as pre-engineered steel.
Cost and delivery risks remain material. Infrastructure Australia notes non-labour input escalations of ~10–20% over the last 12 months, persistent materials cost pressure, and a concentration of steel fabrication—over two-thirds of capacity in NSW/QLD/VIC, while the Northern Territory has <1% of capacity but ~7% of demand—which complicates remote projects and stretches logistics. For oversized portal frames and long-span modules, operators must navigate OSOM permits and route restrictions via the National Heavy Vehicle Regulator and state agencies—adding planning lead time for pilots, bridge/culvert constraints and restricted corridors.
License Options
PDF + Excel
Complete report package
$4,000
Excel Only
Data and analytics
$2,500
Custom Sections
Starts from $100
$0