Belgium Cold Chain Market Outlook to 2029
By Market Structure (Organized vs. Unorganized), By Type of Storage (Refrigerated Warehouse, Cold Rooms, Deep Freezers), By Temperature Type (Chilled, Frozen), By End Users (F&B, Pharmaceuticals, Chemicals, Others), and By Region
Report Overview
Report Code
TDR0254
Coverage
Europe
Published
September 2025
Pages
80
Flexible Purchase Options
Select and purchase only the chapters you need for your strategic decisions
On This Page
Report Overview
The report titled “Belgium Cold Chain Market Outlook to 2029 – By Market Structure (Organized vs. Unorganized), By Type of Storage (Refrigerated Warehouse, Cold Rooms, Deep Freezers), By Temperature Type (Chilled, Frozen), By End Users (F&B, Pharmaceuticals, Chemicals, Others), and By Region” provides a comprehensive analysis of the cold chain industry in Belgium.
Report Coverage
Verified Market Sizing
Multi-layer forecasting with historical data and 5–10 year outlook
Deep-Dive Segmentation
Cross-sectional analysis by product type, end user, application and region
Competitive Benchmarking & Positioning
Market share, operating model, pricing and competition matrices
Actionable Insights & Risk Assessment
High-growth white spaces, underserved segments, technology disruptions and demand inflection points
Review Methodology & Data Structure
Preview report structure, data sources and research framework
Executive Summary
The report titled “Belgium Cold Chain Market Outlook to 2029 – By Market Structure (Organized vs. Unorganized), By Type of Storage (Refrigerated Warehouse, Cold Rooms, Deep Freezers), By Temperature Type (Chilled, Frozen), By End Users (F&B, Pharmaceuticals, Chemicals, Others), and By Region” provides a comprehensive analysis of the cold chain industry in Belgium. The report covers an overview and genesis of the industry, overall market size in terms of revenue, market segmentation; key trends and developments, regulatory landscape, customer level profiling, issues and challenges, and comparative landscape including competition scenario, cross comparison, opportunities and bottlenecks, and company profiling of major players in the Belgium Cold Chain Market. The report concludes with future market projections based on market revenue, by segment, temperature type, end-user industry, region, and a cause-and-effect relationship, along with success case studies highlighting major opportunities and market challenges.
Belgium Cold Chain Market Overview and Size
The Belgium cold chain market reached a valuation of EUR 2.75 billion in 2023, driven by rising pharmaceutical exports, stringent EU food safety norms, and increasing demand for frozen and chilled food products. The market is characterized by key players such as Kuehne + Nagel, Lineage Logistics, Frigologix, and Remitrans. These companies are known for their technologically advanced storage facilities, strong logistics networks, and temperature-controlled transportation capabilities.
In 2023, Lineage Logistics expanded its refrigerated storage capacity in Belgium by launching a new automated warehouse in the Port of Antwerp. This initiative is aimed at improving efficiency and meeting the growing demand from food producers and pharmaceutical companies for reliable cold storage services. Flanders and Wallonia are key hubs due to their strategic location and proximity to logistics corridors and European trade routes.
%252C%25202019-2024.png&w=640&q=75)
What Factors are Leading to the Growth of the Belgium Cold Chain Market:
Surge in Pharmaceutical Trade: Belgium is home to several leading pharmaceutical manufacturers and exporters. The demand for temperature-controlled storage and logistics has increased with the rise in vaccine production and biologics, particularly post-COVID. In 2023, over 60% of biologics exported required strict cold chain compliance, pushing the sector to invest in advanced temperature monitoring and GDP-compliant infrastructure.
Evolving Consumer Preferences: Belgian consumers are increasingly opting for frozen and ready-to-eat meals, with chilled and frozen food sales increasing by 8.5% year-on-year in 2023. This shift is supported by changing lifestyles, higher disposable incomes, and greater urbanization, necessitating better cold storage and last-mile refrigerated delivery solutions.
Stringent Regulatory Framework: The EU’s rigorous food safety and pharmaceutical storage guidelines have led companies to upgrade their infrastructure. In 2023, over 75% of Belgium’s cold storage facilities were compliant with EU Regulation 852/2004 and WHO GDP standards, fostering a more organized and high-quality market structure.
Which Industry Challenges Have Impacted the Growth for Belgium Cold Chain Market
High Operating Costs: One of the major barriers in the cold chain sector is the high cost of energy and refrigeration infrastructure. As per industry estimates, energy expenses account for nearly 30–35% of total cold storage operational costs in Belgium. This significantly impacts the profitability of small- and medium-sized players, discouraging new entrants and expansion in tier-2 cities.
Infrastructure Bottlenecks in Rural Areas: While urban regions like Antwerp and Brussels are well-equipped, rural and semi-urban areas face limited access to cold chain infrastructure. In 2023, over 40% of perishable agri-produce from rural Flanders was reported to suffer quality degradation due to inadequate or delayed cold transportation, creating a significant logistical challenge in bridging the urban-rural cold chain gap.
Workforce and Skill Gaps: Operating modern cold storage systems requires technical expertise in handling temperature-sensitive goods, monitoring systems, and compliance documentation. A 2023 labor market assessment showed that nearly 28% of cold chain operators in Belgium faced difficulties in hiring skilled personnel, particularly for pharmaceutical-grade handling and advanced inventory control systems.
What are the Regulations and Initiatives which have Governed the Market
EU Good Distribution Practice (GDP) Compliance: The European Union mandates strict adherence to Good Distribution Practice guidelines for pharmaceutical products. In Belgium, all pharmaceutical logistics operators are required to maintain GDP certification. As of 2023, over 85% of pharma-linked cold chain providers were GDP-compliant, with real-time temperature logs, calibrated sensors, and audit-ready digital systems.
FAVV Food Safety Regulations: The Federal Agency for the Safety of the Food Chain (FAVV) in Belgium enforces rigorous standards for food storage and transport. Cold storage units must maintain traceable temperature logs and hygiene certifications. In 2023, non-compliance led to the temporary suspension of operations in 6% of audited facilities, indicating strict regulatory oversight.
Carbon Emission Reduction and Sustainability Mandates: In line with EU climate goals, Belgium has introduced incentives for using energy-efficient refrigeration systems and low-GWP refrigerants. The government provides subsidies for solar-integrated cold storage and vehicle retrofitting with electric cooling units. In 2023, approximately 12% of new cold transport vehicles registered in Belgium were hybrid or electric-powered.
Belgium Cold Chain Market Segmentation
By Market Structure: The organized sector dominates the cold chain market in Belgium, primarily due to its adherence to stringent EU regulations, technological advancement, and ability to serve pharmaceutical and high-value food clients. Large-scale operators such as Kuehne + Nagel, Lineage Logistics, and Frigologix offer end-to-end temperature-controlled logistics and storage, ensuring compliance with EU GDP and FAVV standards. The unorganized segment, comprising small regional players, continues to serve local food producers and retailers but lacks the infrastructure and quality assurance to compete for high-margin pharmaceutical and export clients.
%2520on%2520the%2520Basis%2520of%2520Revenue%2520Share%2520in%2520Percentage%252C%25202023.png&w=640&q=75)
By Temperature Type: The frozen segment commands a larger share of the market due to the high demand from frozen food producers, meat exporters, and vaccine logistics. This segment is essential for preserving products below –18°C, particularly in sectors like seafood, meat, and certain biologics. Chilled storage, maintaining a temperature range between 0°C to 8°C, is widely used for dairy, fresh produce, and beverages. Demand for chilled logistics has been rising steadily with the growing retail and convenience food sectors.
%2520on%2520the%2520Basis%2520of%2520Revenue%2520Share%2520in%2520Percentage%252C%25202023.png&w=640&q=75)
By End-User Industry: The food & beverage sector is the largest end-user of cold chain services in Belgium, accounting for a substantial portion of cold storage and transportation demand. This is followed by the pharmaceutical industry, which has seen rapid growth in demand for compliant and highly reliable cold chain solutions due to the rise of biologics, vaccines, and specialty drugs. The chemical and other industrial sectors utilize cold chain logistics for sensitive formulations requiring specific storage conditions.
Competitive Landscape in Belgium Cold Chain Market
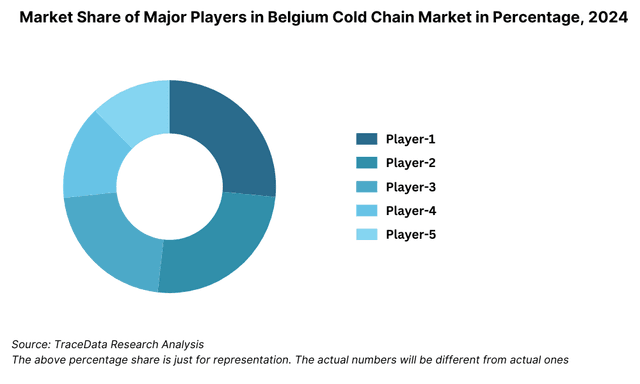
The Belgium cold chain market is moderately concentrated, with a mix of global logistics players and specialized regional cold storage operators. The increasing demand from the pharmaceutical and food & beverage sectors has encouraged both infrastructure expansion and technology integration. Companies like Kuehne + Nagel, Lineage Logistics, Frigologix, Remitrans, and Stockhabo dominate the market, with newer entrants leveraging automation, sustainability, and energy efficiency as competitive differentiators.
Company | Establishment Year | Headquarters |
Kuehne + Nagel | 1890 | Schindellegi, Switzerland |
Lineage Logistics | 2008 | Novi, Michigan, USA (Belgium operations in Antwerp) |
Frigologix | 2003 | Bree, Belgium |
Remitrans | 1982 | Ninove, Belgium |
Stockhabo | 2012 | Mouscron, Belgium |
Some of the recent competitor trends and key information about competitors include:
Kuehne + Nagel: A leading global logistics company with significant cold chain operations in Belgium, Kuehne + Nagel expanded its pharmaceutical logistics capacity in 2023 by launching a new GDP-certified cold storage hub near Brussels Airport. The facility can manage over 20,000 pallet positions across frozen and chilled zones.
Lineage Logistics: Lineage has strengthened its presence in Belgium with a fully automated cold storage warehouse in the Port of Antwerp, operational since 2023. The facility integrates AI-based inventory controls and energy-efficient ammonia refrigeration systems, aimed at serving both food and pharmaceutical clients.
Frigologix: A key player in food-grade cold storage and distribution, Frigologix operates specialized facilities for meat, dairy, and fresh produce. In 2023, the company launched a new BREEAM-certified warehouse with advanced humidity and temperature control systems in Limburg province.
Remitrans: Focused on refrigerated transport, Remitrans manages a fleet of over 250 temperature-controlled trucks and specializes in cross-border food logistics. In 2023, the company reported a 12% increase in its pharmaceutical shipments, owing to upgrades in real-time tracking and GDP compliance.
Stockhabo: Known for custom-built cold warehouses, Stockhabo expanded its footprint in Wallonia in 2023 with a new energy-neutral cold storage center. The facility serves high-value perishable products, including fine chocolates and dairy exports, and uses solar panels and CO₂-based cooling systems.
What Lies Ahead for Belgium Cold Chain Market?
The Belgium cold chain market is expected to grow steadily through 2029, with a strong compound annual growth rate (CAGR), supported by the expansion of pharmaceutical exports, rise in demand for frozen and chilled foods, and the increasing emphasis on sustainability and compliance with EU regulations.
Expansion of Pharma Cold Chain Logistics: With Belgium continuing to be a European hub for vaccine production, biologics, and temperature-sensitive drugs, the demand for GDP-compliant storage and distribution networks is expected to surge. By 2029, it is anticipated that over 70% of pharmaceutical logistics in Belgium will require cold chain integration, driven by innovation in biologics and personalized medicines.
Automation and Smart Warehouse Integration: The adoption of automated storage and retrieval systems (ASRS), AI-powered temperature monitoring, and IoT sensors will become widespread. These technologies will not only reduce operational costs but also improve accuracy and minimize human error. Belgium is projected to have over 60% of new cold storage capacity powered by automation by 2029.
Green and Energy-Efficient Infrastructure: Sustainability will become a key competitive differentiator, with increasing investments in solar-powered warehouses, low-GWP refrigerants, and CO₂-based refrigeration systems. Government-backed energy efficiency incentives are expected to accelerate the adoption of these technologies, especially in newly constructed facilities.
Growth of Online Grocery and Meal Delivery Ecosystem: The rising popularity of e-grocery platforms and ready-to-eat meal delivery services will drive last-mile cold chain demand. Urban centers such as Brussels, Antwerp, and Ghent are expected to witness increased deployment of micro cold storage units and electric refrigerated delivery vehicles to support rapid delivery models.
%252C%25202024-2030.png&w=640&q=75)
Belgium Cold Chain Market Segmentation
• By Market Structure:
o Organized Sector
o Unorganized Sector
• By Type of Storage Facility:
o Refrigerated Warehouses
o Cold Rooms
o Deep Freezers
o Blast Freezers
o Temperature-Controlled Containers
• By Temperature Type:
o Chilled (0°C to 8°C)
o Frozen (–18°C and below)
• By End-User Industry:
o Food & Beverage
o Pharmaceuticals
o Chemicals
o Floriculture
o Others (e.g., Cosmetics, Biotechnology)
• By Transportation Mode:
o Refrigerated Trucks
o Cold Rail Freight
o Air Freight (Temperature Controlled)
o Sea Freight (Reefer Containers)
• By Region:
o Flanders
o Wallonia
o Brussels Capital Region
Players Mentioned in the Report:
• Kuehne + Nagel
• Lineage Logistics
• Frigologix
• Remitrans
• Stockhabo
• DHL Temperature Management Solutions
• Fiege Logistics
• Colfridis
• H Essers
Key Target Audience:
• Cold Chain Logistics Providers
• Food Processing & Export Companies
• Pharmaceutical Manufacturers & Distributors
• Refrigerated Storage Infrastructure Developers
• Cold Transport Fleet Operators
• Regulatory Bodies (e.g., FAVV, EU GDP Inspectors)
• Investment Firms and Infrastructure Funds
• Technology Providers (IoT, Automation, Energy Management)
• Research and Consulting Firms
Time Period:
• Historical Period: 2018–2023
• Base Year: 2024
• Forecast Period: 2024–2029
Explore Flexible Purchase Options or Have Limited Budget?
Pay only for relevant chapters • Customizable report sections
Table of Contents
Choose individual sections to purchase. Mix and match as you like.
4.1. Value Chain Process-“ Role of Entities, Stakeholders, and Challenges They Face
4.2. Revenue Streams for Belgium Cold Chain Market
4.3. Business Model Canvas for Belgium Cold Chain Market
4.4. Cold Storage and Transport Decision-Making Process
4.5. Supply Chain Integration and Logistics Flow
5.1. Food and Pharma Cold Chain Demand Trends in Belgium, 2018-“2024
5.2. Cold Chain Infrastructure Growth-“ Warehousing and Transport Fleet Expansion, 2018-“2024
5.3. Energy and Refrigeration Cost Benchmarking in Belgium, 2024
5.4. Distribution of Cold Storage Facilities by Region and Type
8.1. Revenues, 2018-“2024
8.2. Installed Capacity (in Pallet Positions / m³), 2018-“2024
9.1. By Market Structure (Organized and Unorganized), 2023-“2024P
9.2. By Type of Storage Facility (Warehouse, Cold Rooms, Freezers, etc.), 2023-“2024P
9.3. By Temperature Type (Chilled, Frozen), 2023-“2024P
9.4. By End-User Industry (F&B, Pharma, Chemicals, Others), 2023-“2024P
9.5. By Transportation Mode (Road, Rail, Sea, Air), 2023-“2024P
9.6. By Region (Flanders, Wallonia, Brussels), 2023-“2024P
9.7. By Ownership Type (Leased, Owned, 3PL-Operated), 2023-“2024P
9.8. By Energy Efficiency Classification and Refrigeration Technology, 2023-“2024P
10.1. Customer Segmentation and End-User Profiling
10.2. End-User Journey and Logistics Procurement Process
10.3. Service Needs, SLA Expectations, and Pain Point Analysis
10.4. Gap Analysis and Unmet Needs in Regional and Last-Mile Cold Chain
11.1. Trends and Developments for Belgium Cold Chain Market
11.2. Growth Drivers for Belgium Cold Chain Market
11.3. SWOT Analysis for Belgium Cold Chain Market
11.4. Issues and Challenges for Belgium Cold Chain Market
11.5. Government Regulations and EU Directives Impacting Belgium Cold Chain
12.1. Market Size and Future Potential for Last-Mile Cold Chain Services, 2018-“2029
12.2. Business Model and Revenue Streams in Online Perishables Logistics
12.3. Comparison of Leading Grocery and Meal Delivery Platforms by Cold Chain Dependence
13.1. GDP Compliance Rate and Audit Trends, 2018-“2029
13.2. Distribution of GDP-certified Facilities and Pharma Logistics Providers
13.3. Thermal Packaging and Validation Trends
13.4. Cold Chain Requirements by Pharma Sub-Segment (Vaccines, Biologics, etc.), 2023-“2024P
13.5. Temperature Excursion Risk Management Practices
13.6. Pharma Cold Chain Revenue Contribution, 2018-“2024P
16.1. Benchmark of Key Competitors-“ Company Overview, USP, Strategies, Infrastructure Footprint, Compliance, Fleet Size, Recent Developments
16.2. Strength and Weakness Mapping
16.3. Operating Model Comparison Framework
16.4. Gartner Magic Quadrant for Cold Chain Technology Providers
16.5. Bowmans Strategic Clock for Competitive Positioning
17.1. Revenues, 2025-“2029
17.2. Installed Storage Capacity (m³), 2025-“2029
18.1. By Market Structure (Organized and Unorganized), 2025-“2029
18.2. By Storage Type (Cold Room, Deep Freezer, etc.), 2025-“2029
18.3. By Temperature Type (Chilled vs. Frozen), 2025-“2029
18.4. By End-User Industry (F&B, Pharma, Chemicals, Others), 2025-“2029
18.5. By Region (Flanders, Wallonia, Brussels), 2025-“2029
18.6. By Refrigerant Type (Ammonia, CO‚‚, Hydrocarbon, Synthetic), 2025-“2029
18.7. By Degree of Automation (Manual, Semi-Automated, Fully Automated), 2025-“2029
18.8. By Ownership and Contract Type (In-House, 3PL, Hybrid), 2025-“2029
18.9. By Refrigerated Fleet Composition and Growth, 2025-“2029
18.10. Recommendation
18.11. Opportunity Analysis
Discuss a Customized Research Scope
Custom research scope • Tailored insights • Industry expertise
Research Methodology
Step 1: Ecosystem Creation
Map the ecosystem and identify all demand-side and supply-side entities involved in the Belgium Cold Chain Market. This includes cold storage providers, cold transport operators, pharmaceutical and food industry clients, regulatory bodies, and equipment suppliers. Based on this mapping, we shortlisted 5–6 key players in Belgium using criteria such as financial performance, installed cold storage capacity, network coverage, and compliance certifications (GDP, HACCP, ISO).
Sourcing was conducted through industry whitepapers, EU regulatory filings, company websites, trade publications, and proprietary databases to perform detailed desk research and collate ecosystem-level intelligence.
Step 2: Desk Research
An exhaustive desk research process was carried out using both public and subscription-based secondary databases. We analyzed sector-wide metrics such as market revenue, installed cold storage capacity (in pallet positions), cold fleet size, refrigeration energy efficiency benchmarks, and facility utilization rates.
This was supplemented with detailed company-level analysis including annual reports, financial statements, press releases, investment updates, infrastructure expansion news, regulatory certifications, and public filings with EU health and safety agencies.
Step 3: Primary Research
We conducted in-depth interviews with operational heads, compliance managers, and supply chain executives across major cold chain logistics providers, food processors, pharma manufacturers, and temperature-controlled freight operators in Belgium. These interviews aimed to validate secondary insights, derive pricing benchmarks, and assess capacity utilization and client acquisition strategies.
To validate operational figures, our team employed a disguised interview approach by contacting cold chain providers as prospective clients. This allowed us to cross-check real-world capacity availability, cost structure (€/pallet/month or €/km/ton), response times, and storage limitations. These inputs were critical to understanding value chain economics and ground-level challenges.
Bottom-up data was collected for key players and aggregated to estimate overall market volume and revenue. Similarly, a top-down approach was employed to cross-verify national-level data from logistics and trade bodies.
Step 4: Sanity Check
- Top-down and bottom-up modeling approaches were used for triangulation of data and validation of market sizing. This included comparison of cold storage capacity per capita, pharma export cold chain requirement benchmarks, and food spoilage data due to lack of refrigeration. Final forecasts were derived using growth proxies such as pharmaceutical production, frozen food consumption, and e-commerce grocery penetration.
See What's Inside the Report
Get a preview of key findings, methodology and report coverage
Frequently Asked Questions
The Belgium cold chain market is poised for consistent growth, reaching a valuation of EUR 2.75 billion in 2023. This growth is driven by rising demand for temperature-sensitive logistics in the pharmaceutical and food sectors, strong regulatory enforcement across the EU, and Belgium's strategic geographic position as a key logistics gateway in Europe. The market's potential is further amplified by the rapid adoption of automation, sustainability measures, and cross-border trade integration.
The Belgium Cold Chain Market features prominent players such as Kuehne + Nagel, Lineage Logistics, and Frigologix, which are recognized for their large-scale infrastructure, GDP compliance, and end-to-end cold logistics solutions. Other key operators include Remitrans, Stockhabo, and DHL Temperature Management Solutions, each offering specialized capabilities in refrigerated transport and storage.
Major growth drivers include increasing pharmaceutical exports (particularly biologics and vaccines), rising consumption of frozen and chilled food products, and growing regulatory mandates for cold chain compliance (such as EU GDP and FAVV standards). Additionally, sustainability incentives and the integration of smart warehouse technologies are accelerating market modernization and infrastructure expansion.
The Belgium Cold Chain Market faces several challenges, including high energy and operational costs, limited infrastructure in rural regions, and a shortage of skilled workforce to manage advanced cold storage technologies. Compliance with strict EU regulations also demands continuous investment in monitoring systems and certification processes, which can be burdensome for smaller players.
License Options
PDF + Excel
Complete report package
$4,000
Excel Only
Data and analytics
$2,500
Custom Sections
Starts from $100
$0