Belgium Logistics and Warehousing Market Outlook to 2029
By Market Structure, By Mode of Transportation, By Type of Warehousing, By End-User Industry, By Region
Report Overview
Report Code
TDR0255
Coverage
Europe
Published
September 2025
Pages
80
Flexible Purchase Options
Select and purchase only the chapters you need for your strategic decisions
On This Page
Report Overview
The report titled “Belgium Logistics and Warehousing Market Outlook to 2029 – By Market Structure, By Mode of Transportation, By Type of Warehousing, By End-User Industry, By Region” provides a comprehensive analysis of the logistics and warehousing industry in Belgium. The report covers an overview and genesis of the industry, overall market size in terms of revenue, market segmentation, trends and developments, regulatory landscape, customer profiling, issues and challenges, and comparative landscape including competition scenario, cross comparison, opportunities and bottlenecks, and company profiling of major players in the Logistics and Warehousing Market.
Report Coverage
Verified Market Sizing
Multi-layer forecasting with historical data and 5–10 year outlook
Deep-Dive Segmentation
Cross-sectional analysis by product type, end user, application and region
Competitive Benchmarking & Positioning
Market share, operating model, pricing and competition matrices
Actionable Insights & Risk Assessment
High-growth white spaces, underserved segments, technology disruptions and demand inflection points
Review Methodology & Data Structure
Preview report structure, data sources and research framework
Executive Summary
The report titled “Belgium Logistics and Warehousing Market Outlook to 2029 – By Market Structure, By Mode of Transportation, By Type of Warehousing, By End-User Industry, By Region” provides a comprehensive analysis of the logistics and warehousing industry in Belgium. The report covers an overview and genesis of the industry, overall market size in terms of revenue, market segmentation, trends and developments, regulatory landscape, customer profiling, issues and challenges, and comparative landscape including competition scenario, cross comparison, opportunities and bottlenecks, and company profiling of major players in the Logistics and Warehousing Market. The report concludes with future market projections based on revenue, by market structure, end-use sector, mode of transport, region, and success case studies highlighting key opportunities and risks.
Belgium Logistics and Warehousing Market Overview and Size
The Belgium logistics and warehousing market reached a valuation of EUR 16.2 Billion in 2023, supported by its strategic geographic location in Western Europe, proximity to major EU markets, and world-class infrastructure including the Port of Antwerp and Brussels Airport. The market is dominated by players such as DHL Supply Chain, Kuehne + Nagel, DSV, CEVA Logistics, and DB Schenker, which are known for their strong networks, technology integration, and diversified service portfolios.
In 2023, DSV expanded its state-of-the-art logistics facility in Ghent, focusing on automation and green logistics to cater to demand from automotive and pharma sectors. Key regions such as Antwerp, Brussels, and Liège continue to serve as logistics hotspots due to their connectivity to rail, port, and road networks.
%252C%25202019-2024.png&w=640&q=75)
What Factors are Leading to the Growth of Belgium Logistics and Warehousing Market:
Strategic Location & Infrastructure: Belgium’s position as a gateway to Western Europe, coupled with advanced port, rail, and road infrastructure, makes it a preferred logistics hub for pan-European distribution. The Port of Antwerp is the second largest in Europe and handled over 271 million tonnes of cargo in 2023, facilitating significant growth in freight volume.
Rise in E-commerce & 3PL Services: With e-commerce penetration surpassing 75% in 2023, the demand for last-mile delivery and fulfillment centers has surged. Third-party logistics (3PL) providers are playing a key role in supporting retail and FMCG clients with flexible warehousing and distribution solutions.
Focus on Green Logistics and Automation: Belgium is increasingly adopting automation technologies like AGVs, WMS, and robotics in warehousing operations. Additionally, government and EU sustainability targets are driving investments in low-emission transport and solar-powered warehouses. In 2023, over 35% of logistics facilities under construction were green-certified.
Which Industry Challenges Have Impacted the Growth for Belgium Logistics and Warehousing Market
Rising Operational Costs: One of the major challenges for the logistics sector in Belgium is the steady rise in operational costs, including fuel prices, labor wages, and compliance costs. According to industry estimates, logistics providers experienced an average cost increase of 7.5% in 2023 alone. This has led to pricing pressures, particularly for smaller 3PL firms and independent warehousing operators who face thin margins.
Labor Shortages and Skills Gap: Belgium’s logistics industry is grappling with a shortage of skilled labor, especially in warehousing and long-haul transportation. A 2023 report by the Belgian Logistics Association highlighted that 1 in 4 logistics companies faced workforce shortages, particularly for forklift operators, warehouse managers, and truck drivers. This has impacted operational efficiency and increased reliance on temporary staffing.
Congestion and Urban Delivery Constraints: Urban areas such as Brussels and Antwerp are facing increased congestion, which delays deliveries and raises last-mile delivery costs. Strict urban logistics regulations, including emission-free zones, further complicate access. In 2023, last-mile delivery times in central Brussels increased by 14%, leading to higher customer dissatisfaction and additional costs for express logistics firms.
What are the Regulations and Initiatives which have Governed the Market
EU Emission Norms and Green Logistics Mandates: Belgium, being part of the EU, is governed by stringent emission regulations under the European Green Deal. Logistics operators are required to adopt sustainable practices, including the use of electric or hybrid vehicles for urban deliveries and energy-efficient warehousing. In 2023, over 60% of new fleet additions in urban logistics were electric or CNG-powered, in compliance with regional green mandates.
National Logistics Action Plan (2020–2025): The Federal Government of Belgium launched a strategic logistics roadmap focused on improving multimodal infrastructure, reducing carbon footprint, and digitizing freight movement. Under this initiative, EUR 300 million has been allocated for logistics innovation and infrastructure upgrades, particularly in rail and inland waterways, to reduce dependence on road transport.
Customs and Trade Facilitation Reforms: Belgium’s customs procedures have undergone significant modernization under EU directives, enhancing efficiency for import/export logistics. The implementation of the Union Customs Code (UCC) has enabled faster clearance and reduced dwell times at ports. For instance, the Port of Antwerp reported a 9% improvement in customs clearance times in 2023 due to digital documentation and blockchain pilots.
Belgium Logistics and Warehousing Market Segmentation
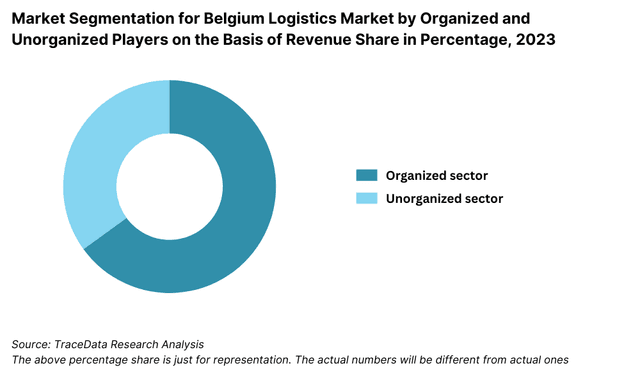
By Market Structure: The logistics market in Belgium is largely organized, with major global 3PL providers and multinational freight operators dominating the landscape due to their access to capital, advanced technologies, and integration across multimodal transport systems. However, unorganized and small regional operators continue to play a critical role in niche services such as regional courier deliveries, SME warehousing, and contract trucking. These players offer localized flexibility, competitive pricing, and personalized services, especially in secondary cities.
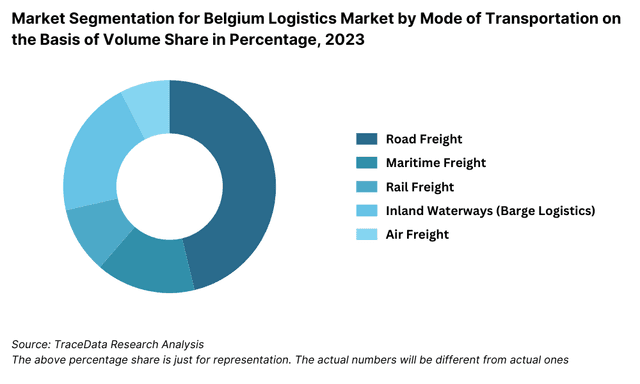
By Mode of Transportation: Road freight remains the most dominant mode due to Belgium's dense highway network and its ability to offer door-to-door connectivity. It is followed by maritime freight, supported by the Port of Antwerp, which handles over 270 million tonnes of cargo annually. Rail and inland waterways are gaining momentum with EU support for greener transport modes. In 2023, rail and barge logistics together handled approximately 18% of total freight volume, largely for bulk goods and cross-border movement to Germany and the Netherlands.
By Type of Warehousing: General warehousing and distribution centers form the backbone of Belgium’s warehousing segment, catering to FMCG, retail, and industrial clients. Specialized warehousing—such as temperature-controlled and bonded warehouses—is expanding due to the strong presence of pharmaceutical, food processing, and chemical industries. In 2023, cold chain warehouses accounted for approximately 14% of total warehousing space, with strong growth driven by exports of medical and biotech products.
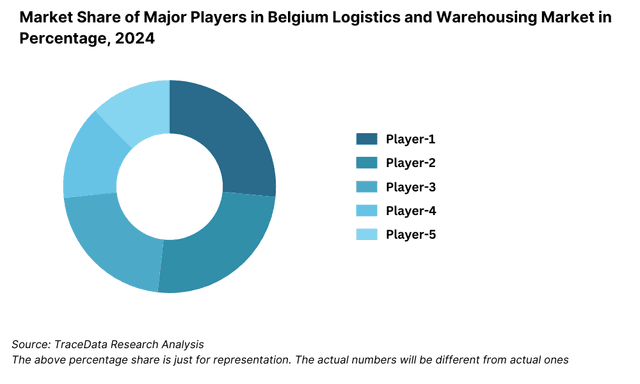
Competitive Landscape in Belgium Logistics and Warehousing Market
The Belgium logistics and warehousing market is moderately consolidated, with a strong presence of global logistics firms, supported by a mix of regional players and niche service providers. The dominance of international companies such as DHL Supply Chain, Kuehne + Nagel, DSV, and DB Schenker is balanced by local specialists that focus on last-mile delivery, pharma logistics, and multimodal transport services. Recent advancements in automation, green logistics, and e-commerce fulfillment have intensified competition across the sector.
Company | Establishment Year | Headquarters |
DHL Supply Chain | 1969 | Bonn, Germany (BE HQ: Diegem) |
Kuehne + Nagel | 1890 | Schindellegi, Switzerland (BE HQ: Antwerp) |
DSV | 1976 | Hedehusene, Denmark (BE HQ: Puurs) |
DB Schenker | 1872 | Essen, Germany (BE HQ: Brussels) |
H.Essers | 1928 | Genk, Belgium |
Ziegler Logistics | 1908 | Brussels, Belgium |
GLS Belgium | 1999 | Drogenbos, Belgium |
Some of the recent competitor trends and key information about competitors include:
DHL Supply Chain: DHL has significantly expanded its warehousing footprint in Belgium, focusing on automation and green-certified facilities. In 2023, the company added over 50,000 sqm of warehousing space near Antwerp and launched an AI-enabled inventory tracking system, improving order accuracy by 18%.
Kuehne + Nagel: Kuehne + Nagel reported a double-digit increase in e-commerce logistics revenues in Belgium, driven by its dedicated fulfillment hubs and investments in robotics. The firm’s logistics hub in Antwerp specializes in FMCG and pharma clients, offering cold chain and bonded warehousing capabilities.
DSV: DSV completed the expansion of its Ghent mega-site in 2023, adding advanced sorting lines and EV-compatible loading bays. The site has become a model for sustainable logistics, operating on 100% renewable energy and offering integrated road-rail transport options.
DB Schenker: With a strong multimodal logistics presence, DB Schenker has capitalized on EU green freight programs by shifting part of its volume from road to rail. In 2023, they launched a new digital booking platform in Belgium, leading to a 12% increase in customer acquisition for B2B clients.
H.Essers: One of the largest Belgian-origin logistics companies, H.Essers specializes in pharma, chemicals, and high-security transport. In 2023, the company announced a EUR 40 million investment to upgrade its Genk facility into a state-of-the-art pharma campus with advanced cold storage zones.
Ziegler Logistics: Ziegler has focused on urban logistics and sustainability, introducing e-cargo bikes and electric delivery vans for short-distance distribution in Brussels. Their 2023 initiative on carbon-neutral delivery solutions has received favorable responses from retail and healthcare clients.
GLS Belgium: GLS has grown its last-mile delivery segment in response to rising e-commerce orders. In 2023, they launched a network of parcel lockers and expanded their express delivery network across Wallonia, boosting delivery capacity by 20% year-over-year.
What Lies Ahead for Belgium Logistics and Warehousing Market?
The Belgium logistics and warehousing market is projected to witness steady growth through 2029, driven by its strategic location, expanding e-commerce sector, and policy push towards green and multimodal logistics. The industry is expected to register a healthy CAGR over the forecast period, supported by public-private investments in infrastructure, digitalization, and sustainability.
Expansion of Green Logistics and Net-Zero Warehousing: With the European Union’s Green Deal and Belgium’s own climate objectives, logistics players are expected to accelerate the adoption of carbon-neutral practices. This includes solar-powered warehouses, electric fleets, and energy-efficient building standards. By 2029, over 50% of newly constructed logistics facilities are expected to be green-certified, contributing to reduced carbon emissions and operational costs.
Rise of E-Commerce Fulfillment Infrastructure: As online retail penetration continues to rise, demand for agile and decentralized fulfillment centers will grow. Belgium’s central location will further cement its position as a hub for cross-border e-commerce logistics. Micro-fulfillment centers near major cities and same-day delivery models are likely to gain prominence by 2026–2029, reshaping last-mile operations.
Automation and Artificial Intelligence in Warehousing: The next wave of investment will be in automation technologies such as robotic picking, automated guided vehicles (AGVs), and AI-powered warehouse management systems. These innovations will improve inventory turnover rates, reduce labor dependency, and boost overall operational efficiency. By 2029, it is estimated that over 30% of large logistics facilities in Belgium will operate semi-autonomously.
Multimodal Infrastructure and Rail Freight Growth: To reduce road congestion and emissions, Belgium is expected to strengthen its multimodal freight corridors. Investments in inland waterways, combined with EU-backed rail connectivity upgrades, will promote modal shift from road to rail and barge. By 2029, multimodal freight is projected to account for nearly 25% of all freight volume handled, especially for industrial and bulk goods.
%252C%25202024-2030.png&w=640&q=75)
Belgium Logistics and Warehousing Market Segmentation
• By Market Structure:
o Organized Logistics Providers
o Unorganized and Regional Operators
o 3PL (Third-Party Logistics) Companies
o 4PL and Integrated Supply Chain Providers
o Courier and Express Delivery Services
o Cold Chain Logistics
o Contract Warehousing
o E-Commerce Fulfillment Centers
• By Mode of Transportation:
o Road Transport
o Rail Transport
o Maritime Transport
o Inland Waterways
o Air Freight
• By Type of Warehousing:
o General Warehousing
o Cold Storage Warehousing
o Bonded Warehousing
o Automated Warehousing
o Distribution Centers
o Urban Micro-Fulfillment Centers
• By End-User Industry:
o Retail & E-Commerce
o FMCG & Consumer Goods
o Pharmaceuticals & Healthcare
o Automotive & Industrial Goods
o Chemical & Hazardous Materials
o Agriculture & Food Processing
o Electronics & Technology
• By Region:
o Flemish Region (e.g., Antwerp, Ghent, Leuven)
o Brussels Capital Region
o Walloon Region (e.g., Liège, Charleroi, Namur)
Players Mentioned in the Report:
• DHL Supply Chain
• Kuehne + Nagel
• DSV
• DB Schenker
• H.Essers
• Ziegler Logistics
• GLS Belgium
• UPS Supply Chain Solutions
• PostNL Belgium
Key Target Audience:
• Third-Party and Fourth-Party Logistics Providers
• Warehousing Infrastructure Developers
• E-Commerce Retailers
• Pharmaceutical and Cold Chain Distributors
• Automotive and Industrial Manufacturers
• Government Bodies (e.g., FPS Mobility and Transport, Belgian Customs)
• Trade Associations (e.g., Logistics in Wallonia, VIL)
• Investment and Infrastructure Funds
Time Period:
• Historical Period: 2018–2023
• Base Year: 2024
• Forecast Period: 2024–2029
Explore Flexible Purchase Options or Have Limited Budget?
Pay only for relevant chapters • Customizable report sections
Table of Contents
Choose individual sections to purchase. Mix and match as you like.
4.1.-¯Value Chain Process-“ Role of Entities, Stakeholders, and Challenges That They Face
4.2.-¯Revenue Streams for Belgium Logistics and Warehousing Market
4.3.-¯Business Model Canvas for Belgium Logistics and Warehousing Market
4.4.-¯Buying Decision Making Process (B2B Shippers and E-Commerce Retailers)
4.5.-¯Supply Decision Making Process (Logistics and Warehousing Providers)
5.1.-¯Logistics Spend in Belgium, 2018-“2024
5.2.-¯Freight Volume by Mode (Road, Rail, Sea, Air), 2018-“2024
5.3.-¯Average Warehousing Rental Rates in Belgium, 2023-“2024
5.4.-¯Number of Logistics and Warehousing Providers by Region
8.1.-¯Revenues, 2018-“2024
8.2.-¯Freight Volume and Warehouse Capacity, 2018-“2024
9.1.-¯By Market Structure (Organized and Unorganized), 2023-“2024P
9.2.-¯By Type of Warehousing (General, Cold Chain, Bonded, Automated), 2023-“2024P
9.3.-¯By Mode of Transportation (Road, Rail, Sea, Air), 2023-“2024P
9.4.-¯By Region (Flanders, Brussels, Wallonia), 2023-“2024P
9.5.-¯By End-User Industry (Retail, FMCG, Pharma, Automotive, Others), 2023-“2024P
10.1.-¯Customer Landscape and Cohort Analysis
10.2.-¯Customer Journey and Procurement Decision Making
10.3.-¯Needs, Preferences, and Pain Point Analysis
10.4.-¯Gap Analysis Framework
11.1.-¯Trends and Developments for Belgium Logistics and Warehousing Market
11.2.-¯Growth Drivers for Belgium Logistics and Warehousing Market
11.3.-¯SWOT Analysis for Belgium Logistics and Warehousing Market
11.4.-¯Issues and Challenges for Belgium Logistics and Warehousing Market
11.5.-¯Government Regulations and Green Logistics Initiatives in Belgium
12.1.-¯Market Size and Future Potential for E-Commerce Warehousing and Last-Mile Delivery, 2018-“2029
12.2.-¯Business Model and Revenue Streams
12.3.-¯Cross Comparison of Leading E-Commerce Logistics Players Based on Company Overview, Warehouse Footprint, Service Offerings, Cities Covered, Technology Stack
13.1.-¯Cold Storage Capacity and Utilization Rates, 2018-“2024
13.2.-¯Temperature-Sensitive Freight Volume and Pharma Logistics Spend, 2018-“2024
13.3.-¯Growth of Biopharma and Life Sciences Sector Driving Logistics Demand
13.4.-¯Key Players and Infrastructure in Belgium Cold Chain
13.5.-¯Technology and Compliance Trends in Pharma Supply Chain
16.1.-¯Benchmark of Key Competitors in Belgium Logistics Market Including Variables Such as Company Overview, USP, Service Offerings, Infrastructure, Fleet Size, Warehouse Space, Key Clients, Business Strategy, Strengths and Weaknesses
16.2.-¯Strength and Weakness
16.3.-¯Operating Model Analysis Framework
16.4.-¯Gartner Magic Quadrant
16.5.-¯Bowmans Strategic Clock for Competitive Advantage
17.1.-¯Revenues, 2025-“2029
17.2.-¯Freight Volume and Warehouse Capacity, 2025-“2029
18.1.-¯By Market Structure (Organized and Unorganized), 2025-“2029
18.2.-¯By Type of Warehousing (General, Cold Chain, Bonded, Automated), 2025-“2029
18.3.-¯By Mode of Transportation (Road, Rail, Sea, Air), 2025-“2029
18.4.-¯By Region (Flanders, Brussels, Wallonia), 2025-“2029
18.5.-¯By End-User Industry (Retail, FMCG, Pharma, Automotive, Others), 2025-“2029
18.6.-¯Recommendation
18.7.-¯Opportunity Analysis
Discuss a Customized Research Scope
Custom research scope • Tailored insights • Industry expertise
Research Methodology
Step 1: Ecosystem Creation
Map the ecosystem and identify all the demand side and supply side entities for Belgium Logistics and Warehousing Market. Basis this ecosystem, we will shortlist leading 5–6 logistics and warehousing companies in the country based upon their financial information, warehousing capacity, freight volume, and service offerings.
Sourcing is made through industry articles, multiple secondary, and proprietary databases to perform desk research around the market to collate industry-level information.
Step 2: Desk Research
Subsequently, we engage in an exhaustive desk research process by referencing diverse secondary and proprietary databases. This approach enables us to conduct a thorough analysis of the market, aggregating industry-level insights. We delve into aspects like the market revenue, number of logistics and warehouse operators, freight volumes, infrastructure expansion, and warehousing space availability.
We supplement this with detailed examinations of company-level data, relying on sources like press releases, annual reports, financial statements, and similar documents. This process aims to construct a foundational understanding of both the market and the entities operating within it.
Step 3: Primary Research
We initiate a series of in-depth interviews with C-level executives and other stakeholders representing various Belgium Logistics and Warehousing Market companies and end-users. This interview process serves a multi-faceted purpose: to validate market hypotheses, authenticate statistical data, and extract valuable operational and financial insights from these industry representatives. Bottom to top approach is undertaken to evaluate revenue contribution and warehousing capacity for each player thereby aggregating to the overall market.
As part of our validation strategy, our team executes disguised interviews wherein we approach each company under the guise of potential customers. This approach enables us to validate the operational and financial information shared by company executives, corroborating this data against what is available in secondary databases. These interactions also provide us with a comprehensive understanding of revenue streams, service pricing, value chain, process design, and operational efficiencies.
Step 4: Sanity Check
- Bottom to top and top to bottom analysis along with market size modeling exercises is undertaken to assess sanity check process.
See What's Inside the Report
Get a preview of key findings, methodology and report coverage
Frequently Asked Questions
The Belgium logistics and warehousing market is poised for significant growth, reaching a valuation of EUR 16.2 Billion in 2023. This growth is fueled by the country’s strategic location at the heart of Europe, advanced multimodal infrastructure, and its role as a key distribution hub for Western Europe. The market’s potential is further enhanced by the rise of e-commerce, green logistics initiatives, and sustained investment in automation and warehouse modernization.
The Belgium logistics and warehousing market features several major players, including DHL Supply Chain, Kuehne + Nagel, DSV, and DB Schenker. These companies dominate the market with their expansive service portfolios, global reach, and investments in technology and sustainability. Other prominent players include H.Essers, Ziegler Logistics, and GLS Belgium.
Key growth drivers include Belgium’s central geographic position, strong port and rail infrastructure, and its role in EU cross-border trade. The rapid growth of e-commerce has driven increased demand for last-mile delivery and fulfillment services. Additionally, government and EU-backed sustainability mandates have accelerated investments in green logistics, while automation and AI are improving operational efficiencies across warehousing and transport.
The Belgium logistics market faces several challenges, including rising operational costs, urban congestion, and a shortage of skilled labor. Regulatory compliance with EU emissions standards and urban low-emission zones can also increase costs for logistics providers. Additionally, intense competition and increasing customer expectations around speed, sustainability, and flexibility are pushing companies to continually upgrade their logistics infrastructure and capabilities.
License Options
PDF + Excel
Complete report package
$4,000
Excel Only
Data and analytics
$2,500
Custom Sections
Starts from $100
$0