India Used Agricultural Equipment Market Outlook to 2029
By Segment (Tractors, Combine Harvesters, Rice Transplanters and Implements), By Channel (C2C Channels, Multi-Brand Dealers, Bank Repossessed Equipment, and OEM Organized), By Age of Equipment and By Region
Report Overview
Report Code
TDR009
Coverage
Asia
Published
September 2024
Pages
80-100
Flexible Purchase Options
Select and purchase only the chapters you need for your strategic decisions
On This Page
Report Overview
The report titled “India Used Agricultural Equipment Market Outlook to 2029 - By Segment (Tractors, Combine Harvesters, Rice Transplanters and Implements), By Channel (C2C Channels, Multi-Brand Dealers, Bank Repossessed Equipment, and OEM Organized), By Age of Equipment and By Region.” provides a comprehensive analysis of the used agricultural equipment market in India. The report covers an overview and genesis of the industry, overall market size in terms of revenue, market segmentation; trends and developments, regulatory landscape, customer level profiling, issues and challenges, and comparative landscape including competition scenario, cross-comparison, opportunities and bottlenecks, and company profiling of major players in the...
Report Coverage
Verified Market Sizing
Multi-layer forecasting with historical data and 5–10 year outlook
Deep-Dive Segmentation
Cross-sectional analysis by product type, end user, application and region
Competitive Benchmarking & Positioning
Market share, operating model, pricing and competition matrices
Actionable Insights & Risk Assessment
High-growth white spaces, underserved segments, technology disruptions and demand inflection points
Review Methodology & Data Structure
Preview report structure, data sources and research framework
Executive Summary
The report titled “India Used Agricultural Equipment Market Outlook to 2029 - By Segment (Tractors, Combine Harvesters, Rice Transplanters and Implements), By Channel (C2C Channels, Multi-Brand Dealers, Bank Repossessed Equipment, and OEM Organized), By Age of Equipment and By Region.” provides a comprehensive analysis of the used agricultural equipment market in India. The report covers an overview and genesis of the industry, overall market size in terms of revenue, market segmentation; trends and developments, regulatory landscape, customer level profiling, issues and challenges, and comparative landscape including competition scenario, cross-comparison, opportunities and bottlenecks, and company profiling of major players in the Used Agricultural Equipment Market. The report concludes with future market projections based on sales revenue, by market, product types, region, cause and effect relationship, and success case studies highlighting the major opportunities and cautions.
India Used Agricultural Equipment Market Overview and Size
The India used agricultural equipment market reached a valuation of INR 75 billion in 2023, driven by the increasing demand for affordable farming machinery, growing rural population, and changing farmer preferences towards more cost-effective agricultural solutions. The market is characterized by major players such as TAFE, Mahindra Tractors, Escorts Agri Machinery, John Deere, and New Holland. These companies are recognized for their extensive distribution networks, diverse equipment offerings, and farmer-focused services.
In 2023, TAFE launched a new initiative to enhance customer experience and streamline the purchase process for used agricultural equipment. This initiative aims to tap into the growing rural market in India and provide a more convenient equipment-buying experience. States like Punjab, Uttar Pradesh, and Maharashtra are key markets due to their high agricultural output and robust farming infrastructure.
Market Size for India Used Agricultural Equipment Industry on the Basis of Volume Sales in Units, 2018-2023

Source: TraceData Research Analysis
What Factors are Leading to the Growth of the India Used Agricultural Equipment Market:
Economic Factors: The economic challenges faced by small and marginal farmers and the high prices of new equipment have significantly shifted farmer preference towards used agricultural equipment. In 2023, used equipment accounted for approximately 45% of total agricultural equipment sales in India, as they offer cost savings of up to 50% compared to new machinery. This trend is particularly pronounced among smallholder farmers looking to minimize expenses.
Growing Rural Population: The expanding rural population, with limited access to credit, is increasingly opting for used equipment as a viable alternative to new machinery. In recent years, the rural population in India has grown by 8%, driving demand for affordable and reliable agricultural solutions. Used equipment provides an accessible entry point to mechanized farming for many in this segment.
Digitalization: The rise of online marketplaces has revolutionized the way farmers purchase used agricultural equipment, enhancing transparency and convenience. In 2023, around 25% of used agricultural equipment transactions in India were conducted online, reflecting a growing trend towards digital channels. These platforms offer comprehensive equipment listings, price comparisons, and customer reviews, which have significantly boosted market growth by making the buying process more accessible and user-friendly.
Which Industry Challenges Have Impacted the Growth of the India Used Agricultural Equipment Market
Quality and Trust Issues: Concerns about the quality and condition of used equipment remain significant challenges. According to a recent industry survey, approximately 60% of farmers are hesitant to purchase used equipment due to fears of hidden defects and a lack of transparent equipment histories. This issue has led to a lower trust level among buyers, potentially deterring up to 30% of prospective purchasers.
Regulatory Hurdles: Stringent regulations concerning equipment inspections and emission standards can limit the availability of certain older or high-mileage used equipment. In 2023, it was reported that around 15% of used equipment offered in the market failed to pass the mandatory inspection standards. These regulations can impose significant costs, particularly on smaller dealerships and private sellers, making it challenging for them to comply.
Financing and Credit Access: Limited access to financing and credit options is a critical barrier in the used agricultural equipment market, particularly affecting lower-income farmers. Data indicates that approximately 40% of potential buyers face difficulties in securing financing for used equipment purchases. This limitation not only restricts market access for a significant segment of the population but also constrains overall market growth.
What are the Regulations and Initiatives which have Governed the Market:
Equipment Inspection Regulations: The Indian government mandates regular equipment inspections to ensure that used agricultural machinery meets specific safety and environmental standards. These inspections are required annually and focus on critical aspects such as engine performance, emissions, and operational safety. In 2022, approximately 80% of used equipment passed the inspection on their first attempt, indicating a significant compliance level among equipment in the market.
Import Restrictions on Used Equipment: The government enforces strict regulations on the importation of used agricultural equipment, including a maximum age limit of 10 years for most machinery. Additionally, all imported equipment must comply with national safety and emissions criteria. In 2023, imports of used equipment dropped by 12% due to stricter enforcement of these regulations.
Government Incentives for Sustainable Farming: To promote sustainable farming practices, the Indian government has introduced various incentives, including subsidies for the purchase of efficient and low-emission equipment. These incentives are particularly aimed at encouraging the adoption of modern and environmentally friendly used agricultural machinery. In 2023, sustainable equipment represented about 10% of the total used equipment sales, a number expected to grow as these incentives take effect.
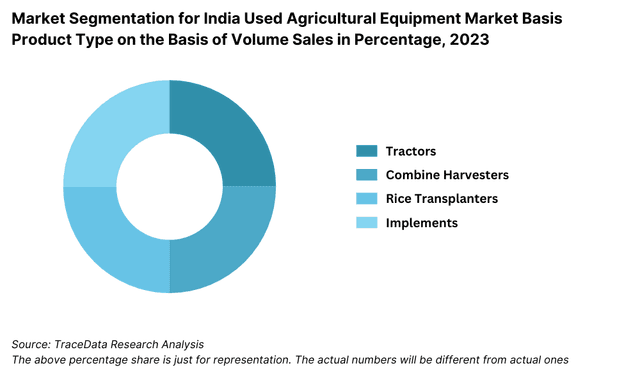
India Used Agricultural Equipment Market Segmentation
By Type: In the analysis of the agricultural equipment market by product type, tractors are the dominant category. Tractors have the broadest application across various farming activities, making them essential for agricultural operations. Their versatility and necessity in both small and large-scale farming operations drive their dominance over other equipment like combine harvesters, rice transplanters, and implements. Tractors are often the first piece of machinery purchased by farmers, leading to higher sales volumes in this category compared to the more specialized equipment.
By Sales Channel: Regarding the origin of sale for organized dealers, C2C channels (Consumer-to-Consumer) dominate the used agricultural equipment market in India. Many transactions occur directly between farmers, often facilitated by word-of-mouth, local markets, or emerging online platforms. This direct exchange allows for better pricing flexibility and accessibility. However, multi-brand dealers and bank repossessed equipment sales are also gaining traction, particularly in regions where there is higher awareness and demand for better-quality used machinery with clear documentation and potential for financing.

By Average Replacement Period: When considering the average replacement period, tractors and other agricultural machinery typically have long replacement cycles, often extending over several years. The dominance in this segment depends on the durability, brand reputation, and the quality of after-sales service offered by the manufacturer. Brands that offer robust and reliable equipment tend to dominate this segment, as their products have longer replacement periods, reducing the frequency of new purchases but solidifying customer loyalty for future replacements
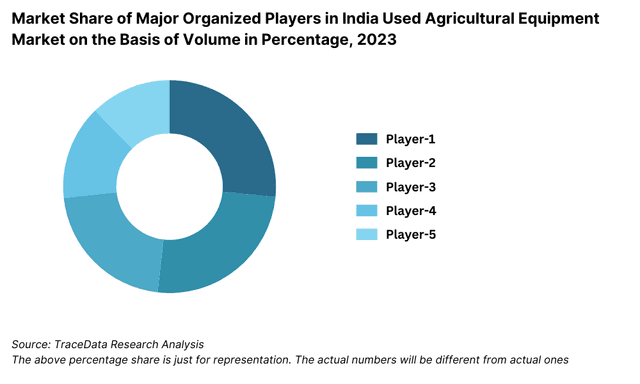
Competitive Landscape in India Used Agricultural Equipment Market
The India used agricultural equipment market is relatively concentrated, with a few major players dominating the space. However, the entrance of new firms and the expansion of online platforms such as TAFE, Mahindra Tractors, Escorts Agri Machinery, John Deere, New Holland, and ITL have diversified the market, offering farmers more choices and services.
| Name | Founding Year | Original Headquarters |
| Trringo | 2016 | Mumbai, India |
| Massey Ferguson | 1960 | Chennai, India |
| Sonalika Tractors | 1969 | Hoshiarpur, Punjab, India |
| Mahindra Tractors | 1945 | Mumbai, India |
| John Deere India Pvt. Ltd. | 1998 | Pune, Maharashtra, India |
| Escorts Agri Machinery | 1944 | Faridabad, Haryana, India |
| Farmkart | 2016 | Barwani, Madhya Pradesh, India |
| Khetigaadi | 2016 | Pune, Maharashtra, India |
| Used Tractors Company | 2012 | New Delhi, India |
| Tractor Junction | 2009 | Alwar, Rajasthan, India |
Some of the recent competitor trends and key information about competitors include:
TAFE: Known for its robust and affordable tractors, TAFE recorded over 80,000 sales in 2023, marking a 10% increase compared to the previous year. The company's strong focus on after-sales service has made it a preferred choice among Indian farmers.
Mahindra Tractors: Mahindra saw a 12% increase in sales of used tractors in 2023. The company's focus on offering high-quality pre-owned equipment with extended warranties has resonated well with budget-conscious farmers.
Escorts Agri Machinery: Escorts reported a 15% growth in used equipment sales in 2023. The company's emphasis on providing a seamless online-to-offline buying experience has contributed to its strong market position.
John Deere: Specializing in high-performance agricultural machinery, John Deere saw a 9% increase in sales in key agricultural states like Punjab and Maharashtra. The company's innovative financing options have been particularly successful in attracting small and medium-scale farmers.
New Holland: The agricultural division of CNH Industrial sold around 30,000 units of used equipment in 2023, with a significant portion coming from their enhanced digital sales channels. The group's focus on integrating online and offline sales experiences has helped increase customer convenience and overall sales volume.
What Lies Ahead for the India Used Agricultural Equipment Market?
The India used agricultural equipment market is projected to grow steadily by 2029, exhibiting a respectable CAGR of 7.5% during the forecast period. This growth is expected to be fueled by economic factors, increasing mechanization, and rising farmer confidence in the used equipment market.
Shift Towards Sustainable Farming: As the Indian government continues to promote sustainable farming initiatives, there is anticipated to be a gradual increase in both the availability and demand for modern used equipment that meets environmental standards. This trend is supported by government incentives and a growing farmer awareness of sustainable agricultural practices.
Integration of Technology: The integration of advanced technologies such as AI and IoT in equipment assessment and pricing processes is expected to provide farmers with more accurate and transparent information. This technological advancement in agriculture will enhance market transparency, boost farmer trust, and streamline the buying process, making it more efficient and user-friendly.
Growth of Certified Pre-Owned (CPO) Programs: The market is seeing a growing trend towards certified pre-owned programs, where used equipment undergoes rigorous inspections and comes with extended warranties. This trend is particularly strong among premium and high-capacity machinery segments, catering to farmers who seek assurance and quality in their purchases. The increasing availability of CPO equipment is expected to attract more buyers who prioritize reliability and post-purchase support.
Focus on Sustainable Practices: There is a rising trend towards sustainable practices within the used agricultural equipment market. This includes initiatives such as eco-friendly refurbishments, the use of recycled materials in equipment repairs, and efforts to offset carbon emissions associated with equipment use. These practices are becoming more important to environmentally conscious farmers and are expected to influence buying decisions.
Future Outlook and Projections for India Used Agricultural Equipment Market on the Basis of Volume Sales in Units, 2024-2029

Source: TraceData Research Analysis

India Used Agricultural Equipment Market Segmentation
- By Market Structure:
- Auction Companies
- C2C
- Multi-Brand Non-Franchise Dealerships
- OEM Certified Dealers
- By Type of Equipment:
- Tractors
- Harvesters
- Tillers
- Seeders
- Plows
- Sprayers
- By Age of Equipment:
- <3 years
- 3-5 years
- 5-10 years
- 10 years
- By Payment:
- Financed
- Non-Financed
- By Region:
- Northern (Punjab, Haryana, Uttar Pradesh)
- Southern (Tamil Nadu, Andhra Pradesh, Karnataka)
- Western (Maharashtra, Gujarat, Rajasthan)
- Central (Madhya Pradesh, Chhattisgarh)
- Eastern (Bihar, West Bengal, Odisha)
Players Mentioned in the Report:
- Trringo
- Massey Ferguson (TAFE - Tractors and Farm Equipment Limited)
- Sonalika Tractors
- Mahindra Tractors (Mahindra & Mahindra)
- John Deere India Pvt. Ltd.
- Escorts Agri Machinery
- Farmkart
- Khetigaadi
- Used Tractors Company
- Tractor Junction
- Mera Tractor
- Escortsmolanmol
- Tractor Guru
Key Target Audience:
- Used Agricultural Equipment Dealers
- Online Equipment Marketplaces
- Agricultural Financing Companies
- Regulatory Bodies (e.g., Ministry of Agriculture & Farmers' Welfare)
- Research and Development Institutions
Time Period:
- Historical Period: 2018-2023
- Base Year: 2024
- Forecast Period: 2024-2029
Explore Flexible Purchase Options or Have Limited Budget?
Pay only for relevant chapters • Customizable report sections
Table of Contents
Choose individual sections to purchase. Mix and match as you like.
4.1. Export & Import of Food Crops in India-“ By Value & Volume, 2023-2024P
4.2. Agricultural Indicators in India & Agricultural Land Area by Utilization in India, 2023-2024P
4.3. Agricultural GDP of India & Production of Top 5 Crops in India, 2023-2024P
4.4. Relevance of agriculture in selected APEC member economies (Contribution of Agriculture, Forestry & Fishing towards Overall GDP, 2023)
4.5. Significance of Technology in India Agriculture Equipment Market (Agribusiness Tools, Digital Marketplace Tools and Digital Tools; Map of Technology and Maturity Stage in India Agriculture Ecosystem)
5.1. Production of Small-Holder Estate Crops, 2018-2024
5.2. Production of Large-Holder Estate Crops, 2018-2024
5.3. Paddy / Rice Production in India (Paddy Production, Paddy Harvested Area, Revenue from Rice Segment and Rice Consumption by Age, 2018-2024)
5.4. Cropping Pattern of Rice in India (Cropping Cycle of Rice in India, Major Rice Producing Regions and Average Temperature in Major Agricultural Regions during Cropping Cycle)
5.5. Characteristics of Farmers & Cross Comparison of Farm Labor Wages, 2020-2023 (Nominal Wages and Real Wages)
5.6. Farmer Decision Making Parameters (Region / Soil Properties, Land Holding Size, Type of Crops, Brand Value & Price, Credit Availability, Fuel Efficiency and After Sales Services & Maintenance Cost)
6.1. Value Chain Process-Role of Entities, Operating Model, Margins Stakeholders, and Challenges they face
6.2. Business Model Canvas for India Agriculture Equipment Market
6.3. Sourcing Model for Used Agricultural Equipment in India
7.1. Equipment Usage Ratio in India, 2018-2024
7.2. Spend on Farming Inputs in India, 2024
10.1. Revenues, 2018-2024P
10.2. Sales Volume, 2018-2024
10.3. Used: New Ratio, 2018-2024
11.1. By Product Type (Tractors, Combine Harvesters, Rice Transplanters and Implements), 2018-2024P
11.2. By Market Structure (Organized and Unorganized Market), 2023-2024P
11.3. By Origin of Sale for Organized Dealers (C2C Channels, Multi-Brand Dealers, Bank Repossessed Equipment, and OEM Organized), 2023-2024P
11.4. By Average Replacement Period, 2023-2024P
11.5. By Financed and Non Financed, 2023-2024P
12.1. Farmer Landscape and Cohort Analysis
12.2. Farmer Journey and Decision Making
12.3. Need, Desire, and Pain Point Analysis
12.4. Gap Analysis Framework
13.1. Trends and Developments for India Used Agriculture Equipment Market
13.2. Growth Drivers for India Used Agriculture Equipment Market
13.3. SWOT Analysis for India Used Agriculture Equipment Market
13.4. Issues and Challenges for India Used Agriculture Equipment Market
13.5. Government Regulations for India Used Agriculture Equipment Market
14.1. Total Finance Disbursed for Used Agricultural Equipment Sales in India, 2018-2024P
14.2. Finance Penetration Rate and Average Down Payment for Used Agriculture Equipment, 2018-2029
14.3. How the Finance Penetration Rates are Changing Over the Years with Reasons
14.4. Type of Used Equipment Segment for which Finance Penetration is Higher
14.5. Used Agriculture Equipment Finance Split by Banks/NBFCs/Private Finance Companies and Captive Entities, 2023-2024P
14.6. Average Used Agriculture Equipment Finance Tenure in India
17.1. Market Size and Future Potential for Online B2C and C2B used Agriculture Equipment market based on transactions, 2018-2029
17.2. Business Model and Revenue Streams
17.3. Cross comparison of leading online used Agri-equipment Companies basis Operational and Financial variables
18.1. Market Share of Key Players in India Used Agri-Equipment Market, 2023
18.2. Benchmark of Key Competitors in India Used Agriculture Equipment Market Including Operational and Financial Variables
18.3. Strength and Weakness
18.4. Operating Model Analysis Framework
18.5. Gartner Magic Quadrant
18.6. Bowmans Strategic Clock for Competitive Advantage
19.1. Revenues, 2025-2029
19.2. Sales Volume, 2025-2029
19.3. Used: New Ratio, 2025-2029
20.1. By Product Type (Tractors, Combine Harvesters, Rice Transplanters and Implements), 2025-2029
20.2. By Market Structure (Organized and Unorganized Market), 2025-2029
20.3. By Origin of Sale for Organized Dealers (C2C Channels, Multi-Brand Dealers, Bank Repossessed Equipment, and OEM Organized), 2025-2029
20.4. By Average Replacement Period, 2025-2029
Discuss a Customized Research Scope
Custom research scope • Tailored insights • Industry expertise
Research Methodology
Step 1: Ecosystem Creation
Map the ecosystem and identify all the demand-side and supply-side entities for the India Used Agricultural Equipment Market. Based on this ecosystem, we will shortlist leading 5-6 manufacturers in the country based on their financial information, production capacity, and volume.
Sourcing is done through industry articles, multiple secondary, and proprietary databases to perform desk research around the market to collate industry-level information.
Step 2: Desk Research
Subsequently, we engage in an exhaustive desk research process by referencing diverse secondary and proprietary databases. This approach enables us to conduct a thorough analysis of the market, aggregating industry-level insights. We delve into aspects like sales revenues, the number of market players, price levels, demand, and other variables. We supplement this with detailed examinations of company-level data, relying on sources like press releases, annual reports, financial statements, and similar documents. This process aims to construct a foundational understanding of both the market and the entities operating within it.
Step 3: Primary Research
We initiate a series of in-depth interviews with C-level executives and other stakeholders representing various India Used Agricultural Equipment Market companies and end-users. This interview process serves a multi-faceted purpose: to validate market hypotheses, authenticate statistical data, and extract valuable operational and financial insights from these industry representatives. A bottom-to-top approach is undertaken to evaluate volume sales for each player, thereby aggregating the overall market.
As part of our validation strategy, our team conducts disguised interviews where we approach each company under the guise of potential customers. This approach enables us to validate the operational and financial information shared by company executives, corroborating this data against what is available in secondary databases. These interactions also provide us with a comprehensive understanding of revenue streams, value chains, processes, pricing, and other factors.
Step 4: Sanity Check
- Bottom-to-top and top-to-bottom analysis, along with market size modeling exercises, are undertaken to assess the sanity check process.
See What's Inside the Report
Get a preview of key findings, methodology and report coverage
Frequently Asked Questions
The India used agricultural equipment market is poised for substantial growth, reaching a valuation of INR 75 Billion in 2023. This growth is driven by factors such as the increasing demand for affordable farming machinery, a growing rural population, and the shift towards more cost-effective agricultural solutions. The market's potential is further bolstered by the expanding digital landscape, which facilitates easier access to a wide range of used equipment.
The India Used Agricultural Equipment Market features several key players, including TAFE, Mahindra Tractors, and Escorts Agri Machinery. These companies dominate the market due to their extensive distribution networks, strong brand presence, and diverse equipment offerings. Other notable players include John Deere and New Holland.
The primary growth drivers include economic factors, such as the high cost of new equipment and the financial constraints faced by small and marginal farmers, which make used equipment a more attractive option. The expanding rural population in India, combined with the rise of digital platforms, also contributes to the growing demand for used agricultural equipment.
The India Used Agricultural Equipment Market faces several challenges, including quality and trust issues related to the condition and history of used machinery. Regulatory challenges, such as stringent equipment inspection and emission standards, can also impact the availability of older models. Additionally, infrastructure challenges, including inadequate dealership networks and the need for improved after-sales services, pose significant barriers to market growth.
License Options
PDF + Excel
Complete report package
$4,000
Excel Only
Data and analytics
$2,500
Custom Sections
Starts from $100
$0