Japan Smart Agriculture Market Outlook to 2029
By Market Structure, By Technologies, By Types of Equipment, By Crop Types, By Age of Farmers, and By Region
Report Overview
Report Code
TDR0105
Coverage
Asia
Published
December 2024
Pages
80-100
Flexible Purchase Options
Select and purchase only the chapters you need for your strategic decisions
On This Page
Report Overview
The report titled “Japan Smart Agriculture Market Outlook to 2029 - By Market Structure, By Technologies, By Types of Equipment, By Crop Types, By Age of Farmers, and By Region” provides a comprehensive analysis of the smart agriculture market in Japan. The report covers an overview and genesis of the industry, overall market size in terms of revenue, market segmentation; trends and developments, regulatory landscape, customer level profiling, issues and challenges, and comparative landscape including competition scenario, cross-comparison, opportunities and bottlenecks, and company profiling of major players in the smart agriculture market.
Report Coverage
Verified Market Sizing
Multi-layer forecasting with historical data and 5–10 year outlook
Deep-Dive Segmentation
Cross-sectional analysis by product type, end user, application and region
Competitive Benchmarking & Positioning
Market share, operating model, pricing and competition matrices
Actionable Insights & Risk Assessment
High-growth white spaces, underserved segments, technology disruptions and demand inflection points
Review Methodology & Data Structure
Preview report structure, data sources and research framework
Executive Summary
The report titled “Japan Smart Agriculture Market Outlook to 2029 - By Market Structure, By Technologies, By Types of Equipment, By Crop Types, By Age of Farmers, and By Region” provides a comprehensive analysis of the smart agriculture market in Japan. The report covers an overview and genesis of the industry, overall market size in terms of revenue, market segmentation; trends and developments, regulatory landscape, customer level profiling, issues and challenges, and comparative landscape including competition scenario, cross-comparison, opportunities and bottlenecks, and company profiling of major players in the smart agriculture market. The report concludes with future market projections based on revenue, by market segment, technologies, region, cause-and-effect relationships, and success case studies highlighting the major opportunities and cautions.
Japan Smart Agriculture Market Overview and Size
The Japan smart agriculture market reached a valuation of JPY 250 Billion in 2023, driven by the increasing adoption of precision farming technologies, rising labor shortages in rural areas, and the government’s focus on modernizing the agricultural sector. The market is characterized by major players such as Kubota Corporation, Yanmar Holdings, Farmnote, Spread Co., Ltd., and NTT Data. These companies are recognized for their innovative solutions, technological expertise, and commitment to advancing agricultural productivity.
In 2023, Kubota Corporation introduced a new autonomous tractor equipped with AI-powered systems to optimize field operations and reduce the burden on farmers. This initiative aligns with the growing trend of automation and digitization in Japan’s agricultural sector. Prefectures such as Hokkaido and Ibaraki are key markets due to their extensive farmlands and advanced farming infrastructure.
Market Size for Japan Smart Agriculture Industry on the Basis of Revenue (JPY Billion), 2018–2024

What Factors Are Leading to the Growth of Japan Smart Agriculture Market:
Technological Advancements: The rapid adoption of IoT-based solutions, drones, and AI-powered equipment has significantly enhanced the efficiency and productivity of Japan’s agricultural sector. In 2023, nearly 35% of large-scale farms in Japan incorporated IoT devices to monitor soil health, crop growth, and weather conditions.
Aging Farmer Population: With an average farmer age of over 67 years, Japan faces critical labor shortages in its agricultural workforce. This demographic challenge has accelerated the shift towards automation and smart farming technologies to ensure sustainable farming practices.
Government Initiatives: The Japanese government’s Smart Agriculture Policy aims to support the adoption of digital technologies and precision farming. Subsidies for autonomous equipment, smart greenhouses, and advanced irrigation systems have fueled market growth, with government funding accounting for 15% of total investments in the sector in 2023.
Which Industry Challenges Have Impacted the Growth for Japan Smart Agriculture Market
High Initial Costs: The high upfront investment required for smart agriculture technologies such as drones, IoT systems, and autonomous machinery is a significant barrier for small and medium-sized farms. In 2023, it was estimated that only 30% of small-scale farmers in Japan could afford to adopt smart agriculture solutions, limiting market penetration among this segment.
Lack of Technical Expertise: A shortage of technical skills among farmers poses challenges in the adoption and effective use of advanced technologies. According to a 2023 survey, 40% of farmers cited a lack of knowledge and training as a major obstacle to implementing smart farming practices. This skills gap often results in underutilization or inefficient use of available technologies.
Aging Farmer Population: With over 65% of Japan’s farmers being 65 years or older, the aging workforce is less likely to adopt new technologies, slowing the overall transition to smart agriculture. This demographic trend reduces the addressable market for high-tech agricultural solutions.
What are the Regulations and Initiatives Which Have Governed the Market
Smart Agriculture Policy: The Japanese government has introduced a Smart Agriculture Policy to encourage the adoption of technologies like autonomous tractors, AI-powered monitoring systems, and smart greenhouses. In 2023, subsidies covered up to 40% of the costs for qualified equipment purchases, helping farmers mitigate high initial expenses.
Environmental Protection Standards: Japan enforces strict regulations on agricultural practices to minimize environmental impact. For example, farmers are required to adopt low-emission machinery and eco-friendly fertilizers. In 2023, compliance with these standards was reported at 85%, showcasing the sector's commitment to sustainable farming.
Data Security and Privacy Laws: Regulations such as Japan's Personal Information Protection Act (PIPA) govern the use of farm data collected by smart devices. In 2023, 90% of smart farming solution providers were compliant with these laws, ensuring farmers’ data security and fostering trust in technology adoption.
Japan Smart Agriculture Market Segmentation
By Market Structure: The market is segmented into traditional and technology-driven farming. Technology-driven farming dominates the market due to the increasing adoption of precision agriculture tools, automated equipment, and AI-driven solutions. Traditional farming still holds a significant share in regions with smaller farms and aging farmer populations, where technological adoption remains slow. However, government subsidies and training programs are gradually encouraging a shift toward modern practices.
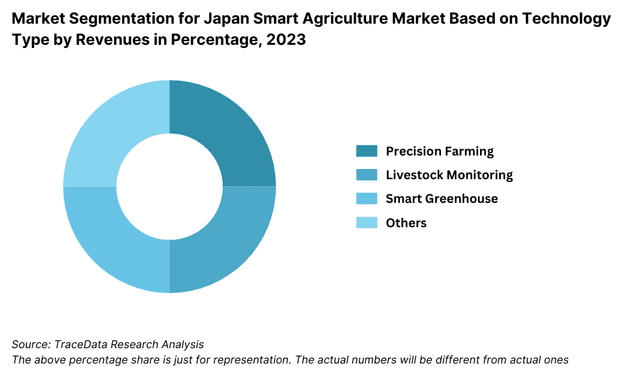
By Technology Type: Precision agriculture technologies such as GPS-guided machinery and IoT sensors hold the largest share due to their widespread adoption for optimizing crop yields and resource utilization. Automated machinery, including autonomous tractors and drones, is also gaining traction as labor shortages drive the demand for automation. Smart greenhouse solutions represent a growing segment, particularly in urban and peri-urban areas, enabling year-round crop production and efficient resource management.
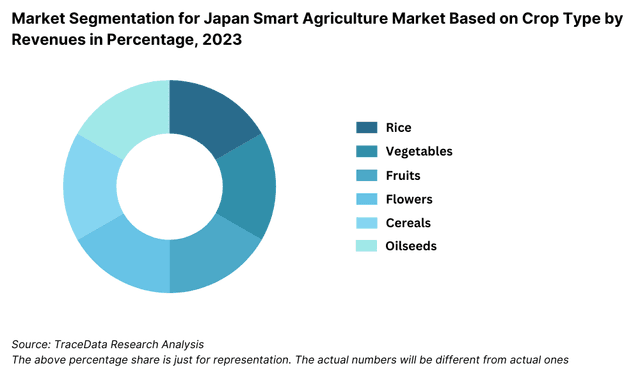
By Crop Type: Rice dominates the smart agriculture market in Japan due to its cultural and economic significance, coupled with the adoption of precision tools for water management and pest control. Vegetables and fruits follow closely, driven by the demand for high-value crops and the implementation of smart greenhouse technologies to ensure consistent quality and supply.
Competitive Landscape in Japan Smart Agriculture Market
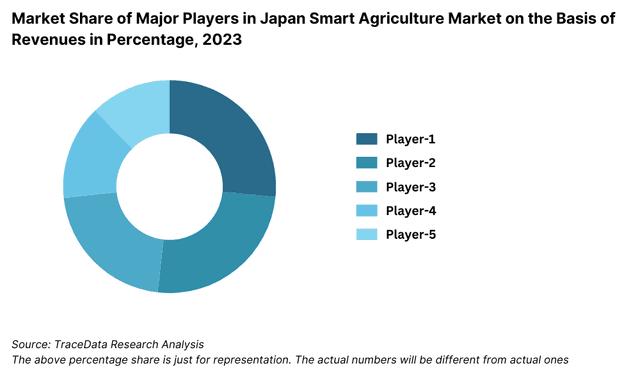
The Japan smart agriculture market is moderately consolidated, with a mix of established players and emerging technology startups driving the market. Companies like Kubota Corporation, Yanmar Holdings, Farmnote, Spread Co., Ltd., and NTT Data lead the industry with their cutting-edge solutions and market presence. Additionally, collaborations with universities and research institutions have enriched the competitive landscape, fostering innovation and technological advancement.
Company Name | Establishment Year | Headquarters |
|---|---|---|
Yanmar Co., Ltd. | 1912 | Osaka, Japan |
Kubota Corporation | 1890 | Osaka, Japan |
OPTiM Corporation | 2000 | Tokyo, Japan |
Sagri Co., Ltd. | 2018 | Hyogo, Japan |
Spread Co., Ltd. | 2006 | Kyoto, Japan |
Farmnote Holdings, Inc. | 2013 | Hokkaido, Japan |
Inaho Co., Ltd. | 2017 | Kanagawa, Japan |
Agrist Inc. | 2019 | Miyazaki, Japan |
Nileworks Inc. | 2015 | Tokyo, Japan |
Vegetalia Inc. | 2014 | Tokyo, Japan |
Some of the recent competitor trends and key information about competitors include:
Kubota Corporation: A pioneer in agricultural machinery, Kubota introduced an autonomous tractor in 2023 featuring AI-driven operational capabilities. The company reported a 20% growth in revenue from its smart agriculture division, largely driven by increased adoption of its precision farming solutions.
Yanmar Holdings: In 2023, Yanmar launched a series of AI-powered rice planting machines designed for small-scale farms. The company saw a 15% increase in sales of smart equipment, particularly in Hokkaido and other regions with large-scale farming operations.
Farmnote: Known for its IoT solutions for livestock management, Farmnote expanded its market share by 25% in 2023. Its flagship cloud-based platform recorded a 40% increase in active users, driven by growing demand for data-driven decision-making in dairy and cattle farming.
Spread Co., Ltd.: A leader in vertical farming, Spread Co., Ltd. enhanced its "Techno Farm" operations in 2023 with robotic harvesting systems, achieving a 30% increase in productivity. The company now supplies over 10% of Japan’s leafy vegetable market, positioning itself as a key player in urban agriculture.
NTT Data: Leveraging its expertise in IT solutions, NTT Data launched a new farm management software in 2023, integrating AI and blockchain for real-time monitoring and secure data sharing. The company reported a 35% rise in subscriptions, highlighting the growing demand for digital transformation in agriculture.
What Lies Ahead for Japan Smart Agriculture Market?
The Japan smart agriculture market is anticipated to grow significantly by 2029, exhibiting a strong CAGR during the forecast period. This growth will be driven by technological advancements, increasing government support, and the rising need for sustainable farming practices in response to labor shortages and environmental challenges.
Expansion of Automation and Robotics: The market is expected to witness a surge in the adoption of autonomous tractors, drones, and robotic harvesters. These technologies will address labor shortages, especially in regions with aging farmer populations, and improve operational efficiency. The introduction of AI-driven systems for real-time monitoring and decision-making will further enhance productivity and profitability.
Integration of IoT and Big Data Analytics: IoT sensors and big data analytics are projected to play a critical role in optimizing resource usage, predicting crop yields, and managing risks associated with climate change. These advancements will empower farmers with actionable insights, leading to better decision-making and increased adoption of smart farming solutions.
Rising Adoption of Smart Greenhouses: Urbanization and the growing demand for year-round, high-quality produce will fuel the development of smart greenhouse systems. Technologies such as automated climate control, vertical farming, and LED-based lighting systems are expected to dominate this segment, particularly in urban and peri-urban areas.
Government Support for Sustainability: Japan’s commitment to reducing greenhouse gas emissions and promoting sustainable agriculture will drive the adoption of eco-friendly practices and technologies. Subsidies for low-emission equipment, smart irrigation systems, and renewable energy-powered solutions will attract investments and encourage farmers to adopt sustainable practices.
Future Outlook and Projections for Japan Smart Agriculture Market on the Basis of Revenues in USD Billion, 2024-2029


Japan Smart Agriculture Market Segmentation
- By Technology Type:
- Precision Farming
- Livestock Monitoring
- Smart Greenhouse
- Others
- By Technology Type:
- IoT
- Drones
- AI
- Robotics
- Others
- By Crop Type:
- Rice
- Vegetables
- Fruits
- Flowers
- Cereals
- Oilseeds
- By Farm Size:
- Small-scale Farms (<2 hectares)
- Medium-scale Farms (2-10 hectares)
- Large-scale Farms (>10 hectares)
- By Region:
- Northern Japan
- Southern Japan
- Central Japan
- Eastern Japan
- Western Japan
Players Mentioned in the Report:
- Yanmar Co., Ltd.
- Kubota Corporation
- OPTiM Corporation
- Sagri Co., Ltd.
- Spread Co., Ltd.
- Farmnote Holdings, Inc.
- Inaho Co., Ltd.
- Agrist Inc.
- Nileworks Inc.
- Vegetalia Inc.
Key Target Audience:
- Smart Agriculture Equipment Manufacturers
- Technology Providers (IoT, AI, and Software Developers)
- Agricultural Cooperatives and Associations
- Government Agencies and Policymakers
- Research and Development Institutions
- Investors and Venture Capital Firms
Time Period:
- Historical Period: 2018–2023
- Base Year: 2024
- Forecast Period: 2024–2029
Explore Flexible Purchase Options or Have Limited Budget?
Pay only for relevant chapters • Customizable report sections
Table of Contents
Choose individual sections to purchase. Mix and match as you like.
4.1. Value Chain Process-“ Role of Entities, Stakeholders, and Challenges They Face
4.2. Revenue Streams for Japan Smart Agriculture Market
4.3. Business Model Canvas for Japan Smart Agriculture Market
4.4. Technology Adoption and Decision-Making Process
4.5. Resource and Supply Allocation Decision Process
5.1. Technology Adoption in Japan Agriculture, 2018-2024
5.2. Traditional vs. Smart Agriculture Market Share, 2018-2024
5.3. Government Spending on Agricultural Modernization, 2024
5.4. Number of Smart Agriculture Equipment Providers by Region
5.5. Agricultural Production in Japan by Crops-By Region, 2024
5.6. Mechanization Rate in Japan, 2024
5.7. Adoption Rate of Smart Agriculture in Japan and Analysis on Crops on which Smart Agriculture is used
8.1. Revenue, 2018-2024
9.1. By Type (Precision Farming, Livestock Monitoring, Smart Greenhouse and others), 2023-2024P
9.2. By Technology Type (IoT, Drones, AI, Robotics, etc.), 2023-2024P
9.3. By Crop Type (Rice, Vegetables, Fruits, Flowers, Cereals, Oilseeds), 2023-2024P
9.4. By Region (Northern, Central, Eastern, Western, and Southern Japan), 2023-2024P
9.5. By Farm Size (Small, Medium, Large), 2023-2024P
10.1. Farmer Landscape and Cohort Analysis
10.2. Farmer Journey and Technology Adoption Decision-Making
10.3. Needs, Desires, and Challenges Analysis
10.4. Gap Analysis Framework
11.1. Trends and Developments in Japan Smart Agriculture Market
11.2. Growth Drivers for Japan Smart Agriculture Market
11.3. SWOT Analysis for Japan Smart Agriculture Market
11.4. Issues and Challenges for Japan Smart Agriculture Market
11.5. Government Regulations for Japan Smart Agriculture Market
12.1. Market Size and Future Potential for IoT and AI Applications, 2018-2029
12.2. Business Models and Revenue Streams
15.1. Market Share of Major Players in Japan Smart Agriculture Market Basis Revenues, 2023
15.2. Benchmark of Key Competitors in Japan Smart Agriculture Market Basis Operational and Financial Variables
15.3. Strength and Weakness Analysis
15.4. Operating Model Analysis Framework
15.5. Gartner Magic Quadrant
15.6. Bowmans Strategic Clock for Competitive Advantage
16.1. Revenue, 2025-2029
17.1. By Type (Precision Farming, Livestock Monitoring, Smart Greenhouse and others), 2025-2029
17.2. By Technology Type (IoT, Drones, AI, Robotics, etc.), 2025-2029
17.3. By Crop Type (Rice, Vegetables, Fruits, Flowers, Cereals, Oilseeds), 2025-2029
17.4. By Region (Northern, Central, Eastern, Western, and Southern Japan), 2025-2029
17.5. By Farm Size (Small, Medium, Large), 2025-2029
17.6. Recommendation
17.7. Opportunity Analysis
Discuss a Customized Research Scope
Custom research scope • Tailored insights • Industry expertise
Research Methodology
Step 1: Ecosystem Creation
Map the ecosystem and identify all the demand-side and supply-side entities for the Japan Smart Agriculture Market. This process involves categorizing key stakeholders, such as technology providers, farmers, government bodies, and research institutions.
Shortlist leading 5–6 companies in the market based on financial performance, technological innovation, and market share. Sourcing is done through industry articles, academic journals, and proprietary databases to gather foundational information about the industry.
Step 2: Desk Research
Conduct exhaustive desk research using secondary and proprietary data sources. This process includes examining market reports, company financials, press releases, and industry analyses to aggregate market-level insights.
Analyze key variables such as revenue, adoption rates, market size, pricing trends, and competitive dynamics. A detailed examination of company-level data, including product launches and technological advancements, is conducted to understand market operations comprehensively.
Step 3: Primary Research
Initiate in-depth interviews with key stakeholders, including executives from technology providers, agricultural cooperatives, and policy advisors. These interactions validate market hypotheses and refine statistical data, providing granular insights into operational strategies and market trends.
Employ disguised interviews with potential end-users and distributors to corroborate data collected from secondary research and understand real-world application scenarios. This bottom-to-top approach ensures accurate estimation of market size and key player contributions.
Step 4: Sanity Check
- Perform top-to-bottom and bottom-to-top market size modeling exercises to verify the reliability and consistency of data. Cross-validation of multiple data points ensures the accuracy and robustness of market estimations.
See What's Inside the Report
Get a preview of key findings, methodology and report coverage
Frequently Asked Questions
The Japan smart agriculture market is projected to grow significantly, reaching an estimated value of JPY 450 billion by 2029. Growth is driven by increasing technological adoption, government subsidies, and a growing demand for sustainable and efficient farming solutions to combat labor shortages and environmental challenges.
Key players include Kubota Corporation, Yanmar Holdings, Farmnote, Spread Co., Ltd., and NTT Data. These companies lead the market with innovative products, strong R&D investments, and extensive market presence. Other notable players include Fujitsu Limited and OPTiM Corporation.
Primary growth drivers include government initiatives to modernize agriculture, advancements in AI and IoT technologies, and increasing demand for automation due to labor shortages. Additionally, rising consumer awareness of sustainable farming practices and the need for climate-resilient agriculture are boosting market adoption.
Challenges include high initial costs of advanced technologies, lack of technical expertise among farmers, and fragmented agricultural landholdings, which limit economies of scale. Regulatory complexities surrounding data privacy and environmental standards also pose barriers to rapid market expansion.
License Options
PDF + Excel
Complete report package
$4,000
Excel Only
Data and analytics
$2,500
Custom Sections
Starts from $100
$0