South Africa Warehousing Market Outlook to 2030
By Market Structure, By Facility Type, By Service Line, By Temperature Class, By End-User Industry, and By Region/Logistics Node
Report Overview
Report Code
TDR0355
Coverage
Africa
Published
October 2025
Pages
80
On This Page
Report Overview
The report titled “South Africa Warehousing Market Outlook to 2030 – By Market Structure, By Facility Type, By Service Line, By Temperature Class, By End-User Industry, and By Region/Logistics Node” provides a comprehensive analysis of the warehousing and distribution market in South Africa. The report covers an overview and genesis of the industry, overall market size in terms of revenue, and detailed market segmentation; it highlights trends and developments, regulatory and licensing landscape, customer-level profiling, issues and challenges, and the competitive landscape including competition scenario, cross-comparison, opportunities and bottlenecks, and company profiling of major players in the warehousing market.
Report Coverage
Verified Market Sizing
Multi-layer forecasting with historical data and 5–10 year outlook
Deep-Dive Segmentation
Cross-sectional analysis by product type, end user, application and region
Competitive Benchmarking & Positioning
Market share, operating model, pricing and competition matrices
Actionable Insights & Risk Assessment
High-growth white spaces, underserved segments, technology disruptions and demand inflection points
Review Methodology & Data Structure
Preview report structure, data sources and research framework
Executive Summary
The report titled “South Africa Warehousing Market Outlook to 2030 – By Market Structure, By Facility Type, By Service Line, By Temperature Class, By End-User Industry, and By Region/Logistics Node” provides a comprehensive analysis of the warehousing and distribution market in South Africa. The report covers an overview and genesis of the industry, overall market size in terms of revenue, and detailed market segmentation; it highlights trends and developments, regulatory and licensing landscape, customer-level profiling, issues and challenges, and the competitive landscape including competition scenario, cross-comparison, opportunities and bottlenecks, and company profiling of major players in the warehousing market. The report concludes with future market projections based on facility absorption, service line demand, end-user industry requirements, regions/logistics nodes, cause-and-effect relationships, and success case studies highlighting the major opportunities and cautions shaping the South African warehousing industry.
South Africa Warehousing Market Overview and Size
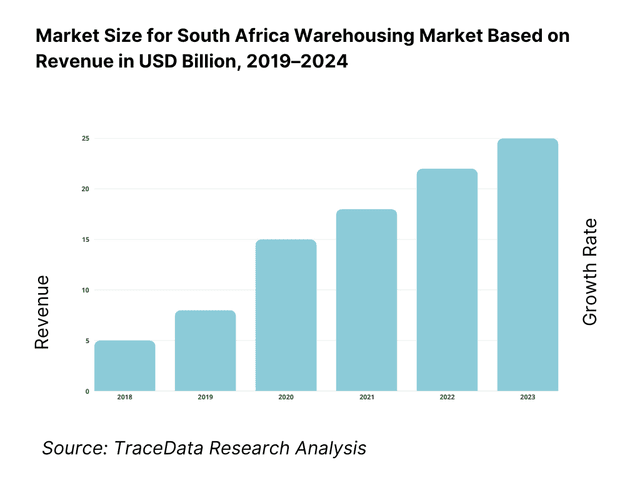
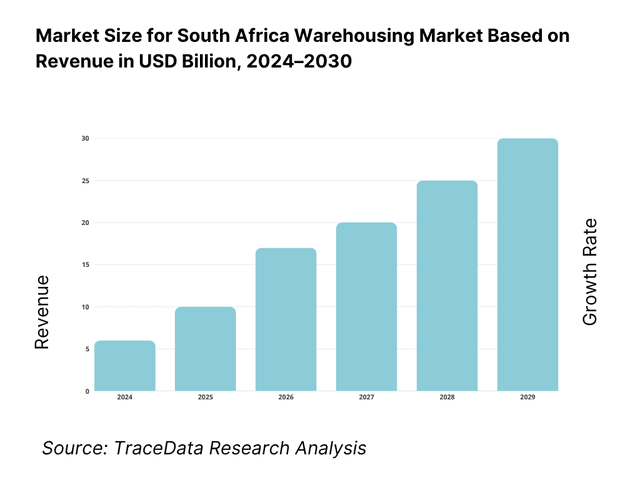
The market is valued at R37.3 billion, based on a five-year historical analysis of the transport & storage industry where storage and warehousing contributed 5.2% of the sector’s R717 billion income. Structural demand is reinforced by online retail reaching R96 billion, deep FMCG flows and expanding fulfilment activity, while ongoing port modernisation and private logistics capex underpin new A-grade boxes and value-added services.
Gauteng is the country’s logistics heartland due to consumption density, national DC clustering and proximity to the N3/N1 corridors, while Durban/eThekwini dominates gateway volumes through Durban Container Terminal’s 3.6 million TEU platform and ongoing terminal upgrades; Cape Town anchors perishables, e-commerce and regional distribution with strong reefer and air-cargo linkages. Node leadership rests on inland demand concentration, port access, intermodal options and SEZ interfaces. Capacity and node-specific roles are confirmed by Transnet and provincial/industry disclosures.
What Factors are Leading to the Growth of the South Africa Warehousing Market:
Trade-led throughput anchoring multi-node warehousing demand: South Africa’s merchandise trade keeps warehouses busy along Durban–Gauteng and Cape Town corridors. Exports of R160.0 billion and imports of R144.6 billion were cleared in a single month, yielding a R15.5 billion surplus; such monthly flows require storage, de-consolidation and value-added services across bonded and ambient facilities. The economy, valued at USD 405.3 billion in current prices, supports deep FMCG and industrial inventories that cycle through distribution centres. On the ground, port operators recorded 346,480–373,644 TEUs in recent months, indicating sustained containerised activity that feeds ICDs and 3PL networks serving national retail and manufacturing footprints.
Freight movement scale across road–rail supporting storage cycles: Quarterly land transport surveys show a payload of 229,744,000 tons in Q4 (road 189,399,000 tons; rail 40,344,000 tons), illustrating the physical volumes that require cross-dock, staging and buffer storage. Rail freight volumes stood at 151.7–154.4 million tons, framing the baseline for depots and sidings linked to mining, automotive and agriculture. This movement interacts with customs and inland clearance nodes as cargo transitions between import/export and domestic legs, enlarging the role of 3PLs for temporary holding, kitting and postponement. The continuity of these flows underpins pallet-position demand and the need for high-throughput facilities on the N3/N1 spines.
SEZ/IDZ industrial platforms and gateway nodes catalysing capacity: There are 12 designated SEZs nationally, with nine operational zones accumulating R30.973 billion in private investment by the latest reporting quarter, driving vendor parks, CKD hubs and bonded warehousing close to ports and airports. Border infrastructure modernisation targets six priority land ports—Beitbridge, Maseru Bridge, Kopfontein, Lebombo, Oshoek and Ficksburg—improving cross-border predictability and warehousing utilisation near gateways. These industrial and border programmes amplify location advantages around Durban, eThekwini–Dube, Coega/Gqeberha and the Gauteng logistics triangle, sustaining take-up for A-grade boxes with higher eaves and yard capacity.
Which Industry Challenges Have Impacted the Growth of the South Africa Warehousing Market:
Power system variability raises resilience requirements for DCs: Electricity generation prints show volatility, with month-to-month changes in output across late-year and seasonal adjustments earlier in the cycle. Such variability forces operators to hedge uptime with gensets, PV and BESS to protect cold stores, WMS, and dock equipment. Independent reviews commissioned by National Treasury highlighted coal-fleet constraints, with an Energy Availability Factor in the low-50s, prompting urgent technical interventions. For warehouses, this translates into rising capex for power backup and heightened risk management in temperature-controlled sites where uninterrupted supply is critical.
Rail underperformance and port frictions tighten supply chains: Rail operators moved only 151.7–154.4 million tons in the most recent reporting period, well below historical benchmarks, limiting rail-served warehouse utilisation and pushing volumes to road depots. Container terminals handled 346,480–373,644 TEUs in recent months, but equipment cycles and congestion create yard backlogs and storage spikes inland. Quarterly payload mixes (road 189,399,000 tons; rail 40,344,000 tons) underscore the outsized role of road, increasing dwell times at cross-docks and DCs when corridors are disrupted. These frictions force 3PLs to hold more safety stock, increase staging capacity and redesign slotting to cushion schedule uncertainty.
Border and compliance complexity increases operating steps: South Africa operates a wide network of ports of entry, with six priority land ports slated for redevelopment (Beitbridge, Maseru Bridge, Kopfontein, Lebombo, Oshoek, Ficksburg), each adding infrastructure and process changes that warehouse operators must align with customs and line-haul planning. Customs flows such as R160.0 billion exports and R144.6 billion imports necessitate rigorous documentation and clearance cycles. At the same time, transport surveys exclude in-house movements, requiring careful separation of contract warehousing from captive flows in planning. The administrative density and documentation cadence raise overheads in bonded and transit storage.
What are the Regulations and Initiatives which have Governed the Market:
Customs storage/bonded warehousing under the Customs & Excise Act: Licensing provisions under Section 19 of the Customs and Excise Act govern customs storage warehouses, covering dutiable imports intended for home use or processing. Recent amendments introduced a specific bonded fuel goods storage category with operational constraints such as a six-month storage period extendable on application and detailed record-keeping obligations. For 3PLs, these requirements shape site design, custody controls and systems integration for clearance declarations, impacting bonded DC layouts and compliance staffing.
Border management and ports-of-entry administration affecting flows: The Border Management Authority oversees ports of entry, with redevelopment of six priority land ports creating new inspection bays, staging areas and traffic flows. Formal postings of acting port commanders at airports, seaports and land borders provide contact points for coordination of bonded moves and transit clearances. For warehouse operators handling SADC cross-border cargo, these nodes define cut-off times, escort protocols and documentation cycles, adding complexity to bonded and inland warehousing operations.
SEZ policy framework for logistics-intensive investment: The SEZ regime governs 12 designated zones across provinces, with R30.973 billion in cumulative private investment in nine operational SEZs by the latest quarter. Tenant codes and customs-controlled areas dictate warehousing uses, including bonded storage, GDP-compliant cold chain, and industry-specific facilities adjacent to ports and cargo terminals. This framework influences where 3PLs and developers place ambient and cold assets, supporting OEMs, pharma, FMCG and agro-exports while shaping approvals, building specifications and customs integration for A-grade logistics parks.
South Africa Warehousing Market Segmentation
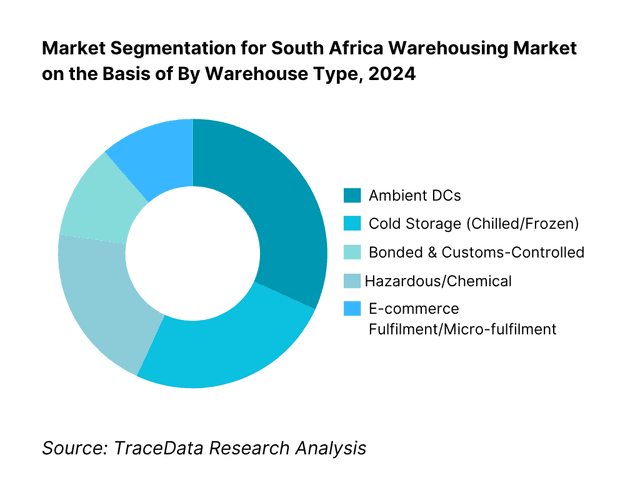
By Warehouse Type: South Africa’s warehousing market is segmented by warehouse type into ambient DCs, cold storage (chilled/frozen), bonded & customs-controlled, hazardous/chemical, and e-commerce fulfilment/micro-fulfilment. Recently, ambient DCs hold a dominant market share under this segmentation. This is due to their role in fast-moving consumer goods and general merchandise replenishment, widespread national network coverage along the N3/N1/N12 corridors, and comparatively lower capex per square metre than cold and hazardous builds. Ambient networks also integrate easily with cross-dock hubs and last-mile partners, keeping inventory turns and OTIF performance high for retailers.
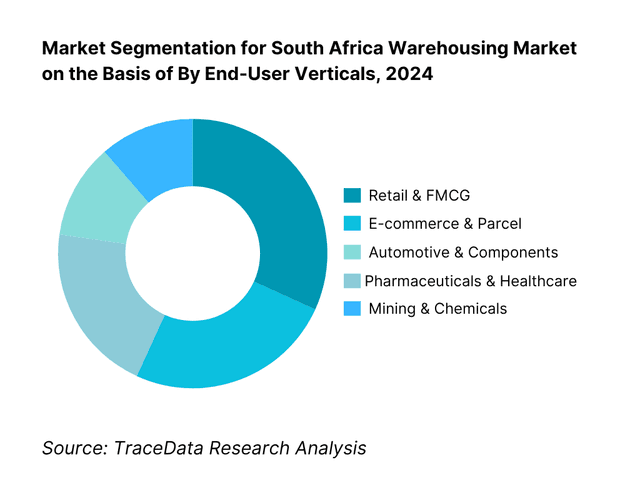
By End-User Verticals: South Africa’s warehousing market is segmented by end-user verticals into retail & FMCG, e-commerce & parcel, automotive & components, pharmaceuticals & healthcare, and mining & chemicals. Recently, retail & FMCG has a dominant market share in this segmentation. This is due to dense store footprints, continuous replenishment cycles, and rapid SKU rotation that require multi-node ambient DCs and cross-dock capability. The category benefits from high grocery throughput and omni-channel models that funnel inventory through regional DCs and urban spokes, stabilising pallet-position demand and supporting large-scale value-added services such as kitting, labelling and co-packing.
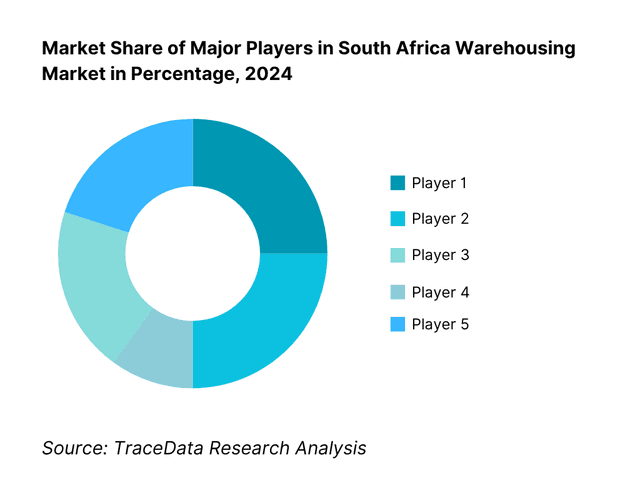
Competitive Landscape in South Africa Warehousing Market
The South Africa Warehousing Market features a blend of global 3PLs, regionally-anchored logistics groups and developer-REITs owning A-grade parks. Competitive intensity is highest along the Durban–Gauteng corridor and in Cape Town logistics triangles. Scale advantages (multi-node networks, WMS/TMS orchestration), sector certifications (GDP/HACCP/ISO) and energy resilience (solar-PV/gensets/BESS) define competitive moats, while e-commerce fulfilment specialists are expanding micro-fulfilment and returns processing footprints. Recent port reforms and equipment upgrades at key terminals are influencing network design and operator strategies.
Name | Founding Year | Original Headquarters |
DP World (Imperial Logistics) | 1946 | Johannesburg, South Africa |
DSV South Africa | 1976 | Kempton Park, South Africa |
DHL Supply Chain South Africa | 1969 | Johannesburg, South Africa |
Kuehne+Nagel South Africa | 1890 | Schindellegi, Switzerland |
DB Schenker South Africa | 1872 | Essen, Germany |
Maersk Logistics & Services | 1904 | Copenhagen, Denmark |
Bidvest International Logistics | 1910 | Johannesburg, South Africa |
Rhenus Logistics South Africa | 1912 | Holzwickede, Germany |
The Logistics Group (TLG) | 2020 | Cape Town, South Africa |
Super Group Supply Chain | 1986 | Johannesburg, South Africa |
Grindrod Logistics | 1910 | Durban, South Africa |
CEVA Logistics South Africa | 2007 | Marseille, France |
Value Logistics | 1981 | Johannesburg, South Africa |
Equites Property Fund | 2006 | Cape Town, South Africa |
Fortress REIT (Developer/REIT) | 2009 | Johannesburg, South Africa |
Some of the Recent Competitor Trends and Key Information About Competitors Include:
DP World (Imperial Logistics): As one of the largest integrated logistics operators in South Africa, Imperial has expanded its multi-client healthcare and automotive warehouses, strengthening compliance with GDP and ISO standards. The company has also invested in renewable energy retrofits across flagship facilities to improve resilience against energy instability.
DSV South Africa: Known for its large-scale DSV Park Gauteng mega-site, DSV has continued to consolidate operations across forwarding, contract logistics and e-commerce fulfilment. The company has integrated warehouse automation systems and solar PV installations, making its facilities more sustainable and operationally efficient.
DHL Supply Chain South Africa: Leveraging its global network, DHL has expanded pharma-compliant cold chain facilities in Gauteng and Cape Town. Recent initiatives include urban fulfilment hubs to support same-day e-commerce deliveries and pilot deployments of WMS-integrated robotics for picking and sorting.
Equites Property Fund: South Africa’s leading logistics REIT has continued to expand its A-grade logistics parks along the Durban–Gauteng corridor. The developer has secured build-to-suit projects for multinational 3PLs and retailers, embedding design features such as 15m eaves and energy-efficient systems to meet the needs of modern tenants.
Fortress REIT: With a growing national logistics portfolio, Fortress has focused on speculative developments in Gauteng and KwaZulu-Natal, capitalising on high take-up in prime logistics nodes. The REIT has also increased its exposure to cross-dock warehouses serving e-commerce and parcel integrators, aligning with the country’s online retail boom.
What Lies Ahead for South Africa Warehousing Market?
The South Africa warehousing market is positioned to expand steadily toward the end of the decade, driven by intensifying e-commerce flows, large-scale trade activity through Durban and Cape Town ports, and continued investment into logistics REIT developments. Structural reforms in port equipment and private participation in rail corridors are expected to gradually improve throughput reliability, reinforcing demand for modern A-grade distribution centres and cold chain facilities.
Rise of Energy-Resilient Warehousing: The future of South Africa’s warehousing sector will be defined by facilities integrating solar-PV, battery storage, and genset back-up systems. With persistent energy supply variability, resilience-focused warehousing will attract both occupiers and investors, ensuring uninterrupted cold chain and high-throughput operations.
Growth of E-commerce Fulfilment Nodes: The rapid rise of online retail, surpassing R96 billion in 2023, will accelerate the development of micro-fulfilment centres and last-mile warehouses in Gauteng, Cape Town, and Durban. These facilities will support shorter lead times, returns processing, and omni-channel fulfilment strategies, reshaping the warehousing landscape.
Expansion of Cold Chain Infrastructure: Increased demand from pharmaceuticals, agriculture, and perishable exports will lead to significant expansion in GDP-compliant cold storage capacity. Facilities with multi-temperature zones will be critical for supporting healthcare logistics and South Africa’s agricultural export base.
Integration of Automation & Digital Twins: The adoption of WMS, TMS, IoT sensors, and robotics is expected to accelerate, enabling predictive slotting, real-time tracking, and enhanced inventory accuracy. This digital transformation will increase operational efficiency and reduce dwell times, helping operators meet higher customer expectations.
South Africa Warehousing Market Segmentation
By Warehouse Type
Ambient distribution centres (multi-client, single-tenant, cross-dock)
Cold storage (chilled +2° to +8°, frozen −18° and below, multi-temp)
Bonded & customs-controlled facilities (CFS/ICD, FTZ/SEZ-linked)
Hazardous/chemical & ADR/DG compliant stores
E-commerce fulfilment & micro-fulfilment hubs
Pharma GDP-compliant facilities
By Service Line
Storage & inventory holding
Value-added services (kitting, labelling, co-pack, postponement)
Cross-dock & consolidation
Contract logistics / 3PL / 4PL control-tower
Returns processing & refurbishment
Customs/bond documentation & brokerage support
By Temperature Class
Ambient
Chilled (+2° to +8°)
Frozen (−18° and below)
Multi-temperature (segregated chambers)
Ultra-cold / specialized pharma (as per GDP)
By Operating/Ownership Model
In-house captive warehouses
Outsourced 3PL/4PL-operated facilities
Leased (developer/REIT-owned) vs owned (occupier-owned)
Build-to-suit (BTS) vs speculative A-grade boxes
By End-User Industry
Retail & FMCG
E-commerce & parcel integrators
Automotive & components (CKD/JIS/JIT, aftermarket)
Pharmaceuticals & healthcare
Mining, chemicals & agriculture (DG/compliance)
Industrial & manufacturing (general)
Players Mentioned in the Report:
DP World (Imperial Logistics)
DSV South Africa
DHL Supply Chain South Africa
Kuehne+Nagel South Africa
DB Schenker South Africa
Maersk Logistics & Services (South Africa)
Bidvest International Logistics
Rhenus Logistics South Africa
The Logistics Group (TLG)
Super Group Supply Chain
Grindrod Logistics
CEVA Logistics South Africa
Value Logistics
Equites Property Fund (Developer/REIT)
Fortress REIT (Developer/REIT).
Key Target Audience
Retail & FMCG corporate logistics directors (national omni-channel operators)
E-commerce marketplaces and D2C brands (fulfilment leaders)
Automotive OEMs and tier suppliers (CKD/JIS/JIT distribution)
Healthcare manufacturers and distributors (GDP warehousing)
Mining & chemical producers (hazardous/compliance storage)
Investments and venture capitalist firms (infrastructure/automation & fulfilment tech)
Government & regulatory bodies
Developer-REITs and industrial park owners
Key Target Audience
Time Period:
Historical Period: 2019-2024
Base Year: 2025
Forecast Period: 2025-2030
See What's Inside the Report
Get a preview of key findings, methodology and report coverage
Table of Contents
1. Executive Summary
2. Research Methodology
3. Ecosystem of Key Stakeholders in South Africa Warehousing Market
4. Value Chain Analysis
4.1. Delivery Model Analysis for Warehousing (3PL, 4PL, Contract Logistics, Bonded, Cold Chain, E-fulfilment-Margins, Preference, Strength and Weakness)
4.2. Revenue Streams for South Africa Warehousing Market (Storage Fees, Value-Added Services, Cross-Docking, Fulfilment, Transportation Integration)
4.3. Business Model Canvas for South Africa Warehousing Market
5. Market Structure
5.1. Developer/REIT vs 3PL vs Freight Forwarder Owned Warehouses
5.2. Investment Model in South Africa Warehousing Market (Greenfield, Brownfield, SEZ/IDZ, Private Equity, REITs)
5.3. Comparative Analysis of the Funnelling Process (Private vs State-Linked Infrastructure-Transnet, SEZs, IDZs)
5.4. Warehouse Budget Allocation by Company Size (Large Enterprises, Medium Enterprises, SMEs)
6. Market Attractiveness for South Africa Warehousing Market
7. Supply-Demand Gap Analysis
8. Market Size for South Africa Warehousing Market Basis
8.1. Revenues, Historic-Current
9. Market Breakdown for South Africa Warehousing Market Basis
9.1. By Market Structure (In-House vs Outsourced/3PL)
9.2. By Warehouse Type (Ambient DCs, Cold Storage, Bonded, Hazardous, Fulfilment Centres)
9.3. By End-User Verticals (Retail & FMCG, E-commerce, Automotive, Pharmaceuticals, Mining & Chemicals)
9.4. By Company Size (Large Enterprises, Medium Enterprises, SMEs)
9.5. By Facility Location (Durban-Gauteng N3 Corridor, Western Cape Triangle, Eastern Cape Automotive Belt, Inland Border Nodes)
9.6. By Ownership (Leased vs Owned)
10. Demand Side Analysis for South Africa Warehousing Market
10.1. Corporate Client Landscape and Cohort Analysis (Retailers, E-commerce Giants, Manufacturers, Pharma Distributors, Agribusiness)
10.2. Warehousing Needs and Decision-Making Process (Node Selection, Facility Specifications, Compliance)
10.3. Warehouse Utilization Effectiveness and ROI Analysis (GLA, Pallet Turns, OTIF Delivery)
10.4. Gap Analysis Framework (Infrastructure vs Demand Hotspots)
11. Industry Analysis
11.1. Trends and Developments for South Africa Warehousing Market (Automation, High-Bay, Dark Stores, Green Warehousing, Bonded Facilities)
11.2. Growth Drivers for South Africa Warehousing Market (E-commerce Growth, Port Throughput, Trade Corridors, Cold Chain Expansion, REIT Investments)
11.3. SWOT Analysis for South Africa Warehousing Market
11.4. Issues and Challenges for South Africa Warehousing Market (Energy Instability, Port Congestion, Skills Shortage, Security & Cargo Theft)
11.5. Government Regulations for South Africa Warehousing Market (Customs Control Acts, Road Freight Axle Load, SEZ Incentives, Pharma GDP)
12. Snapshot on E-commerce Fulfilment Warehousing Market
12.1. Market Size and Future Potential for E-fulfilment Warehousing in South Africa, Historic-Future
12.2. Business Model and Revenue Streams
12.3. Delivery Models and Type of Services Offered (Last-Mile Integration, Micro-fulfilment, Cross-Docking)
13. Opportunity Matrix for South Africa Warehousing Market-Presented with the Help of Radar Chart
14. PEAK Matrix Analysis for South Africa Warehousing Market
15. Competitor Analysis for South Africa Warehousing Market
15.1. Market Share of Key Players in South Africa Warehousing Market Basis Revenues, GLA, Pallet Positions
15.2. Benchmark of Key Competitors in South Africa Warehousing Market Including Variables (Company Overview, USP, Business Strategies, Business Model, GLA, Number of Facilities, Revenues, Pricing, Technology Adoption, Key Clients, Strategic Tie-ups, Marketing Strategy, Recent Developments and others)
15.3. Operating Model Analysis Framework (3PL vs 4PL vs Developer REIT vs In-house)
15.4. Gartner Magic Quadrant (Warehousing & Logistics Service Providers South Africa)
15.5. Bowman’s Strategic Clock for Competitive Advantage
16. Future Market Size for South Africa Warehousing Market Basis
16.1. Revenues, Projection Period
17. Market Breakdown for South Africa Warehousing Market Basis
17.1. By Market Structure (In-House vs Outsourced/3PL)
17.2. By Warehouse Type (Ambient, Cold, Bonded, Hazardous, Fulfilment)
17.3. By End-User Verticals (Retail, FMCG, E-commerce, Automotive, Pharmaceuticals, Mining)
17.4. By Company Size (Large Enterprises, Medium Enterprises, SMEs)
17.5. By Facility Location (Durban-Gauteng Corridor, Western Cape, Eastern Cape, Inland Border Nodes)
17.6. By Ownership (Leased vs Owned)
18. Recommendation
19. Opportunity Analysis
Discuss a Customized Research Scope
Custom research scope • Tailored insights • Industry expertise
Research Methodology
Step 1: Ecosystem Creation
Map the ecosystem and identify all the demand-side and supply-side entities for the South Africa Warehousing Market. Demand side includes national retailers and FMCG brands (omni-channel), e-commerce marketplaces and D2C brands, automotive OEMs and tier suppliers (CKD/JIS/JIT), pharmaceuticals and healthcare distributors (GDP), and mining/chemicals/agri exporters (DG/compliance). Supply side covers 3PL/4PL contract logistics providers, freight forwarders with DCs/CFSs, parcel integrators and LMD hubs, developer-REITs and industrial park owners, cold-chain specialists, and technology/automation vendors (WMS/TMS/AMRs, PV/BESS integrators). Based on this ecosystem, we will shortlist 5–6 leading operators by financials, national node footprint, sector certifications, and anchor client base. Sourcing spans government portals, industry articles, multiple secondary, and proprietary databases to collate industry-level information.
Step 2: Desk Research
Conduct exhaustive desk research using diverse secondary and proprietary databases to build an integrated market view. Compile indicators such as distribution centre counts and GLA, pallet positions, eaves height and spec, temperature-controlled capacity, bonded/hazardous licensing prevalence, inventory turns/OTIF proxies, and corridor/node density (Durban–Gauteng, Western Cape, Eastern Cape, inland border nodes). At company level, extract service mix, facility specifications, compliance stack (GDP/HACCP/ISO/SHEQ), energy resilience (PV/BESS/genset), automation adoption (WMS/TMS/AMRs), flagship sites, client verticals, and WALE where available from press releases, annual reports, investor presentations, and regulatory filings. Correlate this with policy and infrastructure documents (customs/border notices, SEZ/IDZ frameworks, port/rail updates) to construct a defensible baseline for market structure and operator positioning.
Step 3: Primary Research
Initiate in-depth interviews with C-suite and operations leaders across 3PLs/4PLs, freight forwarders, parcel integrators, cold-chain providers, developer-REITs, major occupiers (retail, e-commerce, pharma, automotive), and infrastructure stakeholders (ports/SEZs). Objectives are to validate hypotheses, authenticate statistics, and obtain operational and financial insights (throughput ranges, take-up, VAS mix, node selection criteria, compliance and energy strategies). Apply a bottom-to-top approach to estimate revenue contributions and capacity shares per player and triangulate against top-down indicators from official sources. As part of validation, conduct disguised interviews by approaching selected companies as potential clients to corroborate operational claims (service levels, pricing logic, slotting/returns processes, value-added services scope) with what is observable in secondary datasets and site-level disclosures.
Step 4: Sanity Check
Execute top-down and bottom-up reconciliation with iterative market-size modeling and sensitivity testing. Stress-test results against corridor throughput, port/rail variability, node-specific absorption, and spec-driven cost/throughput assumptions (ambient vs cold, bonded vs hazardous, fulfilment vs cross-dock). Perform outlier analysis on operator metrics (GLA per facility, pallet density, automation penetration, energy resilience) and re-validate anomalies with respondents. Finalise a coherent synthesis that aligns ecosystem realities, operator economics, and infrastructure constraints, ensuring the output is internally consistent, replicable, and audit-ready for strategic use by investors, operators, and enterprise occupiers.
See What's Inside the Report
Get a preview of key findings, methodology and report coverage
Frequently Asked Questions
The South Africa Warehousing Market demonstrates significant potential, supported by the country’s strong trade flows, retail activity, and rising e-commerce penetration. The sector generated R37.3 billion in warehousing income in 2023, according to Statistics South Africa, anchored by high containerised volumes through Durban and Cape Town ports and a growing network of A-grade logistics parks in Gauteng. The market’s potential is further reinforced by ongoing investments in SEZs and cold chain capacity, alongside corporate strategies prioritising resilient, automated, and energy-secure warehousing facilities.
The South Africa Warehousing Market features several global and regional operators. Key players include DP World (Imperial Logistics), DSV South Africa, DHL Supply Chain South Africa, Kuehne+Nagel South Africa, and DB Schenker South Africa. These companies dominate due to their national networks, compliance certifications, and ability to serve multi-sector clients. Other notable players include Bidvest International Logistics, Rhenus Logistics South Africa, Super Group Supply Chain, Grindrod Logistics, and Value Logistics, as well as developers like Equites Property Fund and Fortress REIT.
The primary growth drivers include the scale of South Africa’s trade and freight movements, such as exports of R160.0 billion and imports of R144.6 billion cleared in a single month (SARS, Dec 2024), which underpin warehousing demand across corridors. Rising online retail sales of R96 billion are also fuelling e-fulfilment and micro-warehousing capacity. Additionally, investments of R30.9 billion in SEZs across nine operational zones are catalysing the development of bonded, cold chain, and industry-specific warehouses. These macroeconomic and structural drivers highlight a resilient growth trajectory for the market.
The South Africa Warehousing Market faces challenges linked to energy instability, as electricity generation continues to fluctuate, forcing operators to invest heavily in gensets and solar-PV/BESS systems (Stats SA, Dec 2024). Rail underperformance, with Transnet reporting just over 151.7 million tons moved by rail in 2024, has shifted more volume to roads, creating congestion in cross-dock and storage hubs. In addition, border complexities at six priority land ports—including Beitbridge and Lebombo—add delays and compliance burdens for bonded storage. These issues raise costs, reduce predictability, and constrain optimisation for operators.
License Options
PDF + Excel
Complete report package
$4,000
Excel Only
Data and analytics
$2,500